Immigrants from Chile vs Immigrants from Ireland In Labor Force | Age 45-54
COMPARE
Immigrants from Chile
Immigrants from Ireland
In Labor Force | Age 45-54
In Labor Force | Age 45-54 Comparison
Immigrants from Chile
Immigrants from Ireland
83.2%
IN LABOR FORCE | AGE 45-54
91.6/ 100
METRIC RATING
115th/ 347
METRIC RANK
83.9%
IN LABOR FORCE | AGE 45-54
99.8/ 100
METRIC RATING
22nd/ 347
METRIC RANK
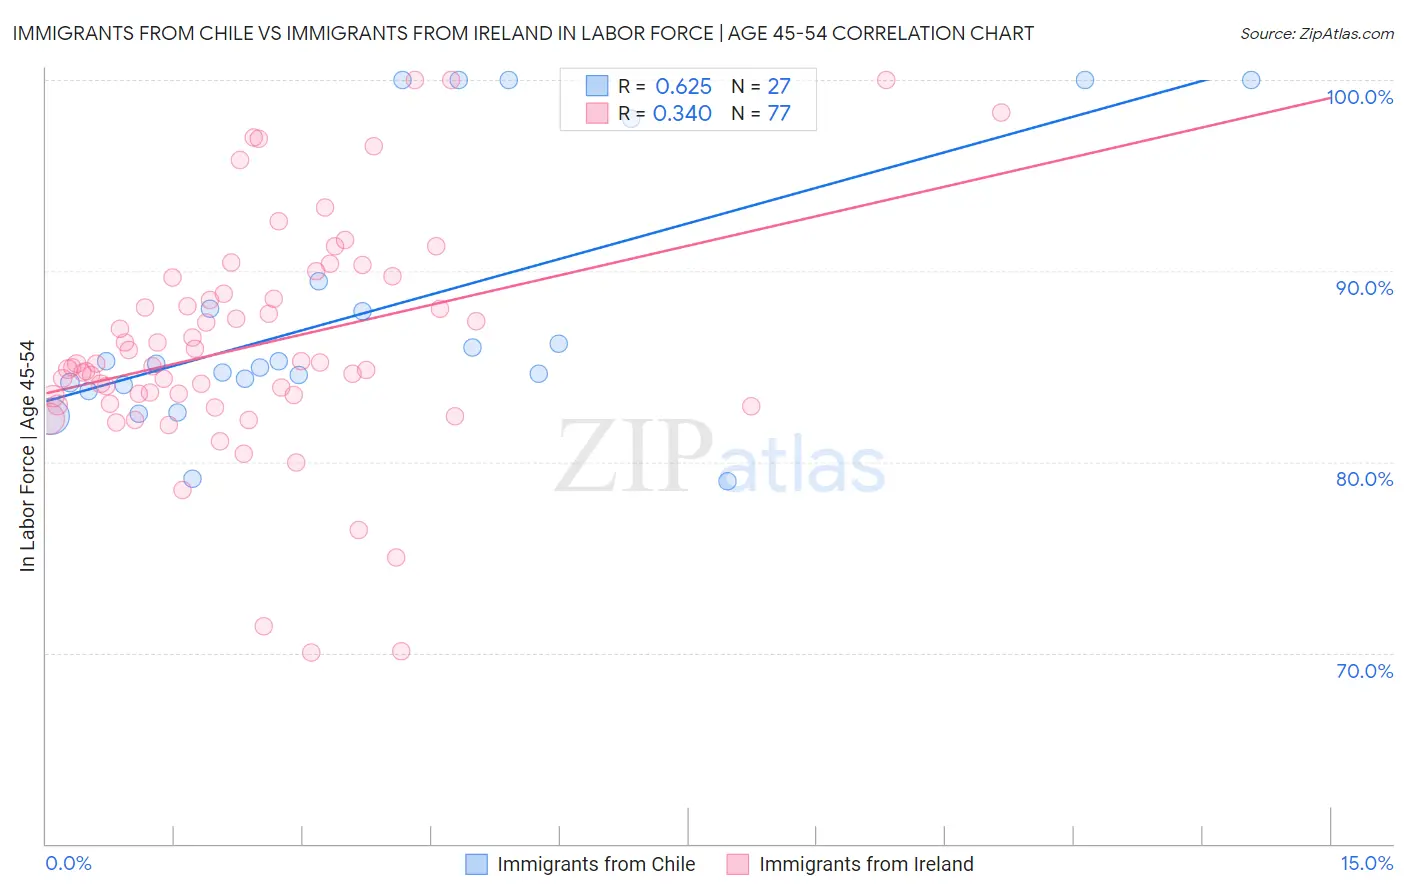
Immigrants from Chile vs Immigrants from Ireland In Labor Force | Age 45-54 Correlation Chart
The statistical analysis conducted on geographies consisting of 218,594,032 people shows a significant positive correlation between the proportion of Immigrants from Chile and labor force participation rate among population between the ages 45 and 54 in the United States with a correlation coefficient (R) of 0.625 and weighted average of 83.2%. Similarly, the statistical analysis conducted on geographies consisting of 240,747,816 people shows a mild positive correlation between the proportion of Immigrants from Ireland and labor force participation rate among population between the ages 45 and 54 in the United States with a correlation coefficient (R) of 0.340 and weighted average of 83.9%, a difference of 0.87%.
In Labor Force | Age 45-54 Correlation Summary
| Measurement | Immigrants from Chile | Immigrants from Ireland |
| Minimum | 79.0% | 70.0% |
| Maximum | 100.0% | 100.0% |
| Range | 21.0% | 30.0% |
| Mean | 87.8% | 86.1% |
| Median | 85.1% | 85.1% |
| Interquartile 25% (IQ1) | 84.1% | 83.2% |
| Interquartile 75% (IQ3) | 89.5% | 89.2% |
| Interquartile Range (IQR) | 5.4% | 6.0% |
| Standard Deviation (Sample) | 6.8% | 6.1% |
| Standard Deviation (Population) | 6.7% | 6.0% |
Similar Demographics by In Labor Force | Age 45-54
Demographics Similar to Immigrants from Chile by In Labor Force | Age 45-54
In terms of in labor force | age 45-54, the demographic groups most similar to Immigrants from Chile are Assyrian/Chaldean/Syriac (83.2%, a difference of 0.0%), Immigrants from Malaysia (83.2%, a difference of 0.0%), Immigrants from Albania (83.2%, a difference of 0.010%), Immigrants from Afghanistan (83.2%, a difference of 0.020%), and Immigrants from China (83.2%, a difference of 0.020%).
| Demographics | Rating | Rank | In Labor Force | Age 45-54 |
| Slovaks | 92.8 /100 | #108 | Exceptional 83.2% |
| Ukrainians | 92.7 /100 | #109 | Exceptional 83.2% |
| Immigrants | Africa | 92.6 /100 | #110 | Exceptional 83.2% |
| Immigrants | Italy | 92.5 /100 | #111 | Exceptional 83.2% |
| Immigrants | Afghanistan | 92.4 /100 | #112 | Exceptional 83.2% |
| Immigrants | Albania | 91.8 /100 | #113 | Exceptional 83.2% |
| Assyrians/Chaldeans/Syriacs | 91.7 /100 | #114 | Exceptional 83.2% |
| Immigrants | Chile | 91.6 /100 | #115 | Exceptional 83.2% |
| Immigrants | Malaysia | 91.4 /100 | #116 | Exceptional 83.2% |
| Immigrants | China | 90.9 /100 | #117 | Exceptional 83.2% |
| Immigrants | Europe | 90.7 /100 | #118 | Exceptional 83.2% |
| Immigrants | Uruguay | 90.2 /100 | #119 | Exceptional 83.2% |
| Immigrants | Russia | 90.1 /100 | #120 | Exceptional 83.2% |
| Uruguayans | 89.4 /100 | #121 | Excellent 83.1% |
| Immigrants | Vietnam | 88.9 /100 | #122 | Excellent 83.1% |
Demographics Similar to Immigrants from Ireland by In Labor Force | Age 45-54
In terms of in labor force | age 45-54, the demographic groups most similar to Immigrants from Ireland are Immigrants from Eastern Africa (83.9%, a difference of 0.0%), Immigrants from Sri Lanka (83.9%, a difference of 0.0%), Tlingit-Haida (83.9%, a difference of 0.0%), Czech (83.9%, a difference of 0.010%), and Slovene (83.9%, a difference of 0.010%).
| Demographics | Rating | Rank | In Labor Force | Age 45-54 |
| Cypriots | 99.9 /100 | #15 | Exceptional 84.1% |
| Immigrants | Nepal | 99.9 /100 | #16 | Exceptional 84.0% |
| Zimbabweans | 99.9 /100 | #17 | Exceptional 84.0% |
| Immigrants | South Central Asia | 99.9 /100 | #18 | Exceptional 84.0% |
| Czechs | 99.8 /100 | #19 | Exceptional 83.9% |
| Immigrants | Eastern Africa | 99.8 /100 | #20 | Exceptional 83.9% |
| Immigrants | Sri Lanka | 99.8 /100 | #21 | Exceptional 83.9% |
| Immigrants | Ireland | 99.8 /100 | #22 | Exceptional 83.9% |
| Tlingit-Haida | 99.8 /100 | #23 | Exceptional 83.9% |
| Slovenes | 99.8 /100 | #24 | Exceptional 83.9% |
| Immigrants | North Macedonia | 99.8 /100 | #25 | Exceptional 83.9% |
| Immigrants | Serbia | 99.8 /100 | #26 | Exceptional 83.9% |
| Immigrants | Brazil | 99.8 /100 | #27 | Exceptional 83.9% |
| Immigrants | Lithuania | 99.8 /100 | #28 | Exceptional 83.9% |
| Immigrants | Pakistan | 99.7 /100 | #29 | Exceptional 83.8% |