Welsh vs Carpatho Rusyn In Labor Force | Age 45-54
COMPARE
Welsh
Carpatho Rusyn
In Labor Force | Age 45-54
In Labor Force | Age 45-54 Comparison
Welsh
Carpatho Rusyns
82.3%
IN LABOR FORCE | AGE 45-54
9.2/ 100
METRIC RATING
206th/ 347
METRIC RANK
83.5%
IN LABOR FORCE | AGE 45-54
98.3/ 100
METRIC RATING
60th/ 347
METRIC RANK
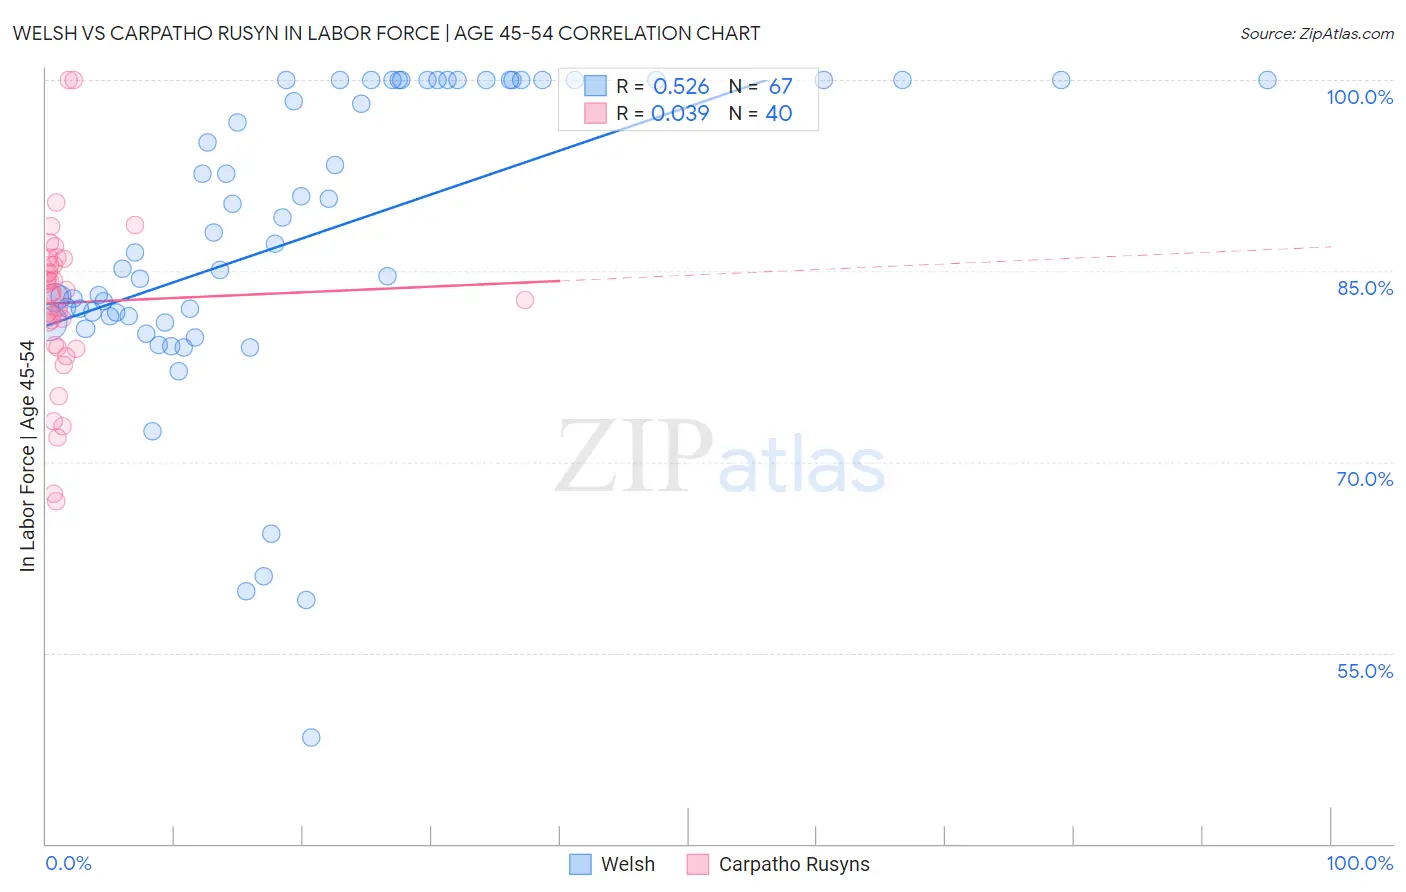
Welsh vs Carpatho Rusyn In Labor Force | Age 45-54 Correlation Chart
The statistical analysis conducted on geographies consisting of 528,109,261 people shows a substantial positive correlation between the proportion of Welsh and labor force participation rate among population between the ages 45 and 54 in the United States with a correlation coefficient (R) of 0.526 and weighted average of 82.3%. Similarly, the statistical analysis conducted on geographies consisting of 58,870,959 people shows no correlation between the proportion of Carpatho Rusyns and labor force participation rate among population between the ages 45 and 54 in the United States with a correlation coefficient (R) of 0.039 and weighted average of 83.5%, a difference of 1.4%.
In Labor Force | Age 45-54 Correlation Summary
| Measurement | Welsh | Carpatho Rusyn |
| Minimum | 48.4% | 66.9% |
| Maximum | 100.0% | 100.0% |
| Range | 51.6% | 33.1% |
| Mean | 87.7% | 82.5% |
| Median | 87.2% | 83.2% |
| Interquartile 25% (IQ1) | 81.4% | 79.1% |
| Interquartile 75% (IQ3) | 100.0% | 85.7% |
| Interquartile Range (IQR) | 18.6% | 6.6% |
| Standard Deviation (Sample) | 11.9% | 6.7% |
| Standard Deviation (Population) | 11.8% | 6.6% |
Similar Demographics by In Labor Force | Age 45-54
Demographics Similar to Welsh by In Labor Force | Age 45-54
In terms of in labor force | age 45-54, the demographic groups most similar to Welsh are Senegalese (82.4%, a difference of 0.010%), Immigrants from Cabo Verde (82.3%, a difference of 0.020%), Native Hawaiian (82.3%, a difference of 0.020%), Immigrants from Western Europe (82.4%, a difference of 0.040%), and Immigrants from Lebanon (82.3%, a difference of 0.050%).
| Demographics | Rating | Rank | In Labor Force | Age 45-54 |
| Moroccans | 15.7 /100 | #199 | Poor 82.5% |
| French Canadians | 15.4 /100 | #200 | Poor 82.5% |
| Canadians | 15.1 /100 | #201 | Poor 82.4% |
| Immigrants | Western Asia | 14.9 /100 | #202 | Poor 82.4% |
| Arabs | 11.6 /100 | #203 | Poor 82.4% |
| Immigrants | Western Europe | 10.9 /100 | #204 | Poor 82.4% |
| Senegalese | 9.5 /100 | #205 | Tragic 82.4% |
| Welsh | 9.2 /100 | #206 | Tragic 82.3% |
| Immigrants | Cabo Verde | 8.6 /100 | #207 | Tragic 82.3% |
| Native Hawaiians | 8.5 /100 | #208 | Tragic 82.3% |
| Immigrants | Lebanon | 7.4 /100 | #209 | Tragic 82.3% |
| Immigrants | Bahamas | 7.1 /100 | #210 | Tragic 82.3% |
| Immigrants | Syria | 6.6 /100 | #211 | Tragic 82.3% |
| Ecuadorians | 6.3 /100 | #212 | Tragic 82.3% |
| Immigrants | Uzbekistan | 5.8 /100 | #213 | Tragic 82.3% |
Demographics Similar to Carpatho Rusyns by In Labor Force | Age 45-54
In terms of in labor force | age 45-54, the demographic groups most similar to Carpatho Rusyns are Bhutanese (83.5%, a difference of 0.0%), Filipino (83.5%, a difference of 0.0%), Eastern European (83.5%, a difference of 0.020%), Paraguayan (83.5%, a difference of 0.030%), and Immigrants from Taiwan (83.5%, a difference of 0.030%).
| Demographics | Rating | Rank | In Labor Force | Age 45-54 |
| Peruvians | 98.7 /100 | #53 | Exceptional 83.6% |
| Somalis | 98.7 /100 | #54 | Exceptional 83.5% |
| Macedonians | 98.7 /100 | #55 | Exceptional 83.5% |
| Immigrants | Peru | 98.6 /100 | #56 | Exceptional 83.5% |
| Paraguayans | 98.5 /100 | #57 | Exceptional 83.5% |
| Eastern Europeans | 98.5 /100 | #58 | Exceptional 83.5% |
| Bhutanese | 98.3 /100 | #59 | Exceptional 83.5% |
| Carpatho Rusyns | 98.3 /100 | #60 | Exceptional 83.5% |
| Filipinos | 98.3 /100 | #61 | Exceptional 83.5% |
| Immigrants | Taiwan | 98.0 /100 | #62 | Exceptional 83.5% |
| Afghans | 97.9 /100 | #63 | Exceptional 83.5% |
| Immigrants | Kenya | 97.9 /100 | #64 | Exceptional 83.5% |
| Egyptians | 97.9 /100 | #65 | Exceptional 83.5% |
| Asians | 97.7 /100 | #66 | Exceptional 83.4% |
| Chileans | 97.7 /100 | #67 | Exceptional 83.4% |