Asian vs Immigrants from Ireland In Labor Force | Age 45-54
COMPARE
Asian
Immigrants from Ireland
In Labor Force | Age 45-54
In Labor Force | Age 45-54 Comparison
Asians
Immigrants from Ireland
83.4%
IN LABOR FORCE | AGE 45-54
97.7/ 100
METRIC RATING
66th/ 347
METRIC RANK
83.9%
IN LABOR FORCE | AGE 45-54
99.8/ 100
METRIC RATING
22nd/ 347
METRIC RANK
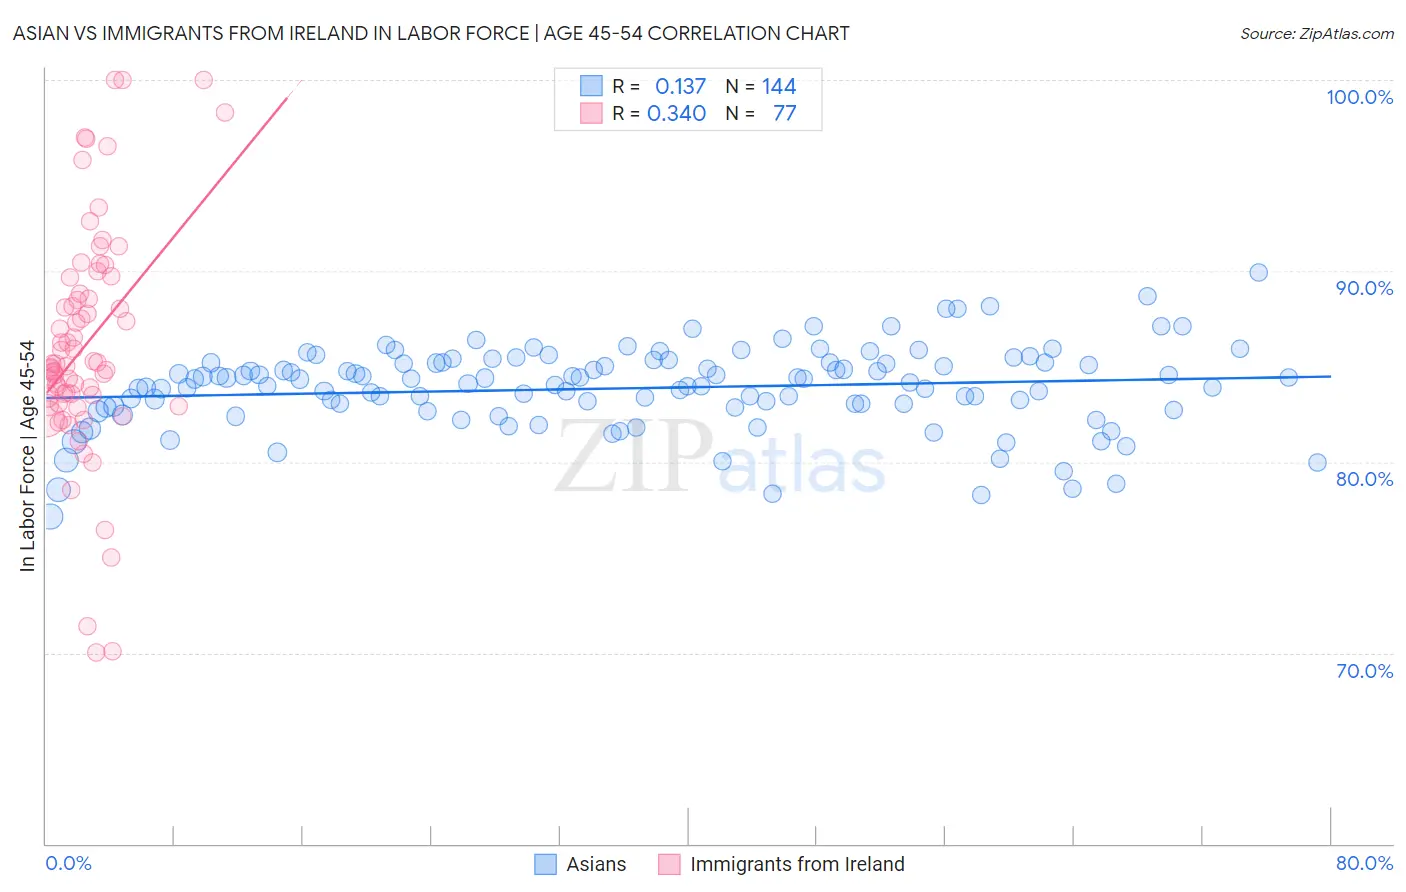
Asian vs Immigrants from Ireland In Labor Force | Age 45-54 Correlation Chart
The statistical analysis conducted on geographies consisting of 550,172,667 people shows a poor positive correlation between the proportion of Asians and labor force participation rate among population between the ages 45 and 54 in the United States with a correlation coefficient (R) of 0.137 and weighted average of 83.4%. Similarly, the statistical analysis conducted on geographies consisting of 240,747,816 people shows a mild positive correlation between the proportion of Immigrants from Ireland and labor force participation rate among population between the ages 45 and 54 in the United States with a correlation coefficient (R) of 0.340 and weighted average of 83.9%, a difference of 0.57%.
In Labor Force | Age 45-54 Correlation Summary
| Measurement | Asian | Immigrants from Ireland |
| Minimum | 77.1% | 70.0% |
| Maximum | 89.9% | 100.0% |
| Range | 12.8% | 30.0% |
| Mean | 83.9% | 86.1% |
| Median | 84.1% | 85.1% |
| Interquartile 25% (IQ1) | 82.8% | 83.2% |
| Interquartile 75% (IQ3) | 85.2% | 89.2% |
| Interquartile Range (IQR) | 2.3% | 6.0% |
| Standard Deviation (Sample) | 2.2% | 6.1% |
| Standard Deviation (Population) | 2.2% | 6.0% |
Similar Demographics by In Labor Force | Age 45-54
Demographics Similar to Asians by In Labor Force | Age 45-54
In terms of in labor force | age 45-54, the demographic groups most similar to Asians are Chilean (83.4%, a difference of 0.0%), Egyptian (83.5%, a difference of 0.010%), Afghan (83.5%, a difference of 0.020%), Immigrants from Kenya (83.5%, a difference of 0.020%), and Immigrants from Colombia (83.4%, a difference of 0.020%).
| Demographics | Rating | Rank | In Labor Force | Age 45-54 |
| Bhutanese | 98.3 /100 | #59 | Exceptional 83.5% |
| Carpatho Rusyns | 98.3 /100 | #60 | Exceptional 83.5% |
| Filipinos | 98.3 /100 | #61 | Exceptional 83.5% |
| Immigrants | Taiwan | 98.0 /100 | #62 | Exceptional 83.5% |
| Afghans | 97.9 /100 | #63 | Exceptional 83.5% |
| Immigrants | Kenya | 97.9 /100 | #64 | Exceptional 83.5% |
| Egyptians | 97.9 /100 | #65 | Exceptional 83.5% |
| Asians | 97.7 /100 | #66 | Exceptional 83.4% |
| Chileans | 97.7 /100 | #67 | Exceptional 83.4% |
| Immigrants | Colombia | 97.6 /100 | #68 | Exceptional 83.4% |
| Taiwanese | 97.5 /100 | #69 | Exceptional 83.4% |
| Immigrants | Latvia | 97.4 /100 | #70 | Exceptional 83.4% |
| Colombians | 97.3 /100 | #71 | Exceptional 83.4% |
| Serbians | 97.2 /100 | #72 | Exceptional 83.4% |
| Immigrants | Czechoslovakia | 97.1 /100 | #73 | Exceptional 83.4% |
Demographics Similar to Immigrants from Ireland by In Labor Force | Age 45-54
In terms of in labor force | age 45-54, the demographic groups most similar to Immigrants from Ireland are Immigrants from Eastern Africa (83.9%, a difference of 0.0%), Immigrants from Sri Lanka (83.9%, a difference of 0.0%), Tlingit-Haida (83.9%, a difference of 0.0%), Czech (83.9%, a difference of 0.010%), and Slovene (83.9%, a difference of 0.010%).
| Demographics | Rating | Rank | In Labor Force | Age 45-54 |
| Cypriots | 99.9 /100 | #15 | Exceptional 84.1% |
| Immigrants | Nepal | 99.9 /100 | #16 | Exceptional 84.0% |
| Zimbabweans | 99.9 /100 | #17 | Exceptional 84.0% |
| Immigrants | South Central Asia | 99.9 /100 | #18 | Exceptional 84.0% |
| Czechs | 99.8 /100 | #19 | Exceptional 83.9% |
| Immigrants | Eastern Africa | 99.8 /100 | #20 | Exceptional 83.9% |
| Immigrants | Sri Lanka | 99.8 /100 | #21 | Exceptional 83.9% |
| Immigrants | Ireland | 99.8 /100 | #22 | Exceptional 83.9% |
| Tlingit-Haida | 99.8 /100 | #23 | Exceptional 83.9% |
| Slovenes | 99.8 /100 | #24 | Exceptional 83.9% |
| Immigrants | North Macedonia | 99.8 /100 | #25 | Exceptional 83.9% |
| Immigrants | Serbia | 99.8 /100 | #26 | Exceptional 83.9% |
| Immigrants | Brazil | 99.8 /100 | #27 | Exceptional 83.9% |
| Immigrants | Lithuania | 99.8 /100 | #28 | Exceptional 83.9% |
| Immigrants | Pakistan | 99.7 /100 | #29 | Exceptional 83.8% |