Welsh vs Dutch West Indian In Labor Force | Age 45-54
COMPARE
Welsh
Dutch West Indian
In Labor Force | Age 45-54
In Labor Force | Age 45-54 Comparison
Welsh
Dutch West Indians
82.3%
IN LABOR FORCE | AGE 45-54
9.2/ 100
METRIC RATING
206th/ 347
METRIC RANK
78.2%
IN LABOR FORCE | AGE 45-54
0.0/ 100
METRIC RATING
324th/ 347
METRIC RANK
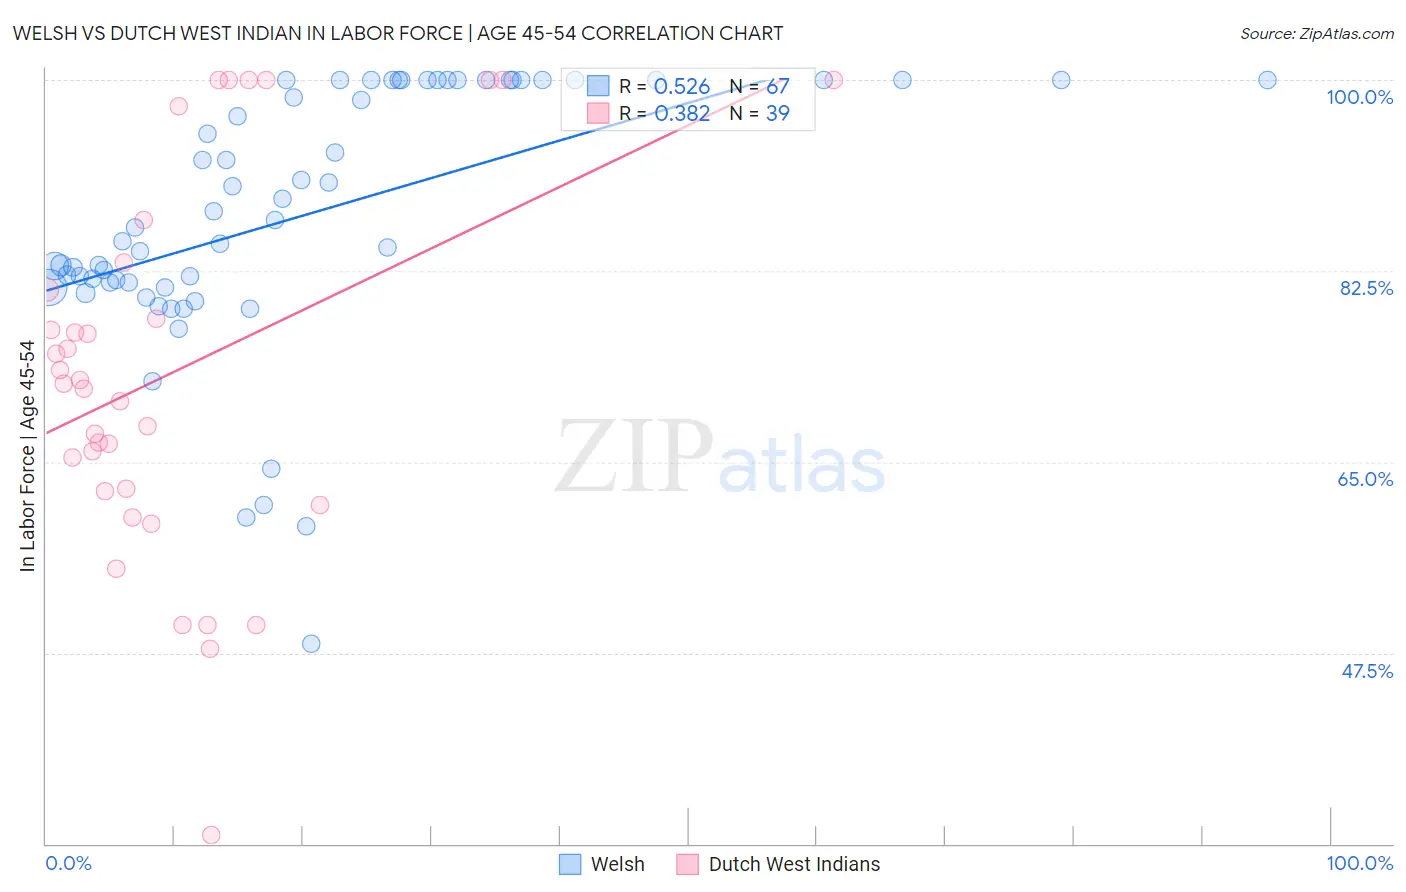
Welsh vs Dutch West Indian In Labor Force | Age 45-54 Correlation Chart
The statistical analysis conducted on geographies consisting of 528,109,261 people shows a substantial positive correlation between the proportion of Welsh and labor force participation rate among population between the ages 45 and 54 in the United States with a correlation coefficient (R) of 0.526 and weighted average of 82.3%. Similarly, the statistical analysis conducted on geographies consisting of 85,763,377 people shows a mild positive correlation between the proportion of Dutch West Indians and labor force participation rate among population between the ages 45 and 54 in the United States with a correlation coefficient (R) of 0.382 and weighted average of 78.2%, a difference of 5.2%.
In Labor Force | Age 45-54 Correlation Summary
| Measurement | Welsh | Dutch West Indian |
| Minimum | 48.4% | 30.8% |
| Maximum | 100.0% | 100.0% |
| Range | 51.6% | 69.2% |
| Mean | 87.7% | 73.3% |
| Median | 87.2% | 72.2% |
| Interquartile 25% (IQ1) | 81.4% | 62.3% |
| Interquartile 75% (IQ3) | 100.0% | 83.3% |
| Interquartile Range (IQR) | 18.6% | 21.0% |
| Standard Deviation (Sample) | 11.9% | 17.4% |
| Standard Deviation (Population) | 11.8% | 17.1% |
Similar Demographics by In Labor Force | Age 45-54
Demographics Similar to Welsh by In Labor Force | Age 45-54
In terms of in labor force | age 45-54, the demographic groups most similar to Welsh are Senegalese (82.4%, a difference of 0.010%), Immigrants from Cabo Verde (82.3%, a difference of 0.020%), Native Hawaiian (82.3%, a difference of 0.020%), Immigrants from Western Europe (82.4%, a difference of 0.040%), and Immigrants from Lebanon (82.3%, a difference of 0.050%).
| Demographics | Rating | Rank | In Labor Force | Age 45-54 |
| Moroccans | 15.7 /100 | #199 | Poor 82.5% |
| French Canadians | 15.4 /100 | #200 | Poor 82.5% |
| Canadians | 15.1 /100 | #201 | Poor 82.4% |
| Immigrants | Western Asia | 14.9 /100 | #202 | Poor 82.4% |
| Arabs | 11.6 /100 | #203 | Poor 82.4% |
| Immigrants | Western Europe | 10.9 /100 | #204 | Poor 82.4% |
| Senegalese | 9.5 /100 | #205 | Tragic 82.4% |
| Welsh | 9.2 /100 | #206 | Tragic 82.3% |
| Immigrants | Cabo Verde | 8.6 /100 | #207 | Tragic 82.3% |
| Native Hawaiians | 8.5 /100 | #208 | Tragic 82.3% |
| Immigrants | Lebanon | 7.4 /100 | #209 | Tragic 82.3% |
| Immigrants | Bahamas | 7.1 /100 | #210 | Tragic 82.3% |
| Immigrants | Syria | 6.6 /100 | #211 | Tragic 82.3% |
| Ecuadorians | 6.3 /100 | #212 | Tragic 82.3% |
| Immigrants | Uzbekistan | 5.8 /100 | #213 | Tragic 82.3% |
Demographics Similar to Dutch West Indians by In Labor Force | Age 45-54
In terms of in labor force | age 45-54, the demographic groups most similar to Dutch West Indians are Kiowa (78.3%, a difference of 0.020%), Choctaw (78.2%, a difference of 0.090%), Crow (78.3%, a difference of 0.10%), Seminole (78.1%, a difference of 0.14%), and Cajun (78.1%, a difference of 0.15%).
| Demographics | Rating | Rank | In Labor Force | Age 45-54 |
| Comanche | 0.0 /100 | #317 | Tragic 79.2% |
| Chickasaw | 0.0 /100 | #318 | Tragic 79.0% |
| Cherokee | 0.0 /100 | #319 | Tragic 79.0% |
| Yaqui | 0.0 /100 | #320 | Tragic 78.9% |
| Yup'ik | 0.0 /100 | #321 | Tragic 78.6% |
| Crow | 0.0 /100 | #322 | Tragic 78.3% |
| Kiowa | 0.0 /100 | #323 | Tragic 78.3% |
| Dutch West Indians | 0.0 /100 | #324 | Tragic 78.2% |
| Choctaw | 0.0 /100 | #325 | Tragic 78.2% |
| Seminole | 0.0 /100 | #326 | Tragic 78.1% |
| Cajuns | 0.0 /100 | #327 | Tragic 78.1% |
| Sioux | 0.0 /100 | #328 | Tragic 78.0% |
| Creek | 0.0 /100 | #329 | Tragic 77.7% |
| Cheyenne | 0.0 /100 | #330 | Tragic 77.6% |
| Tsimshian | 0.0 /100 | #331 | Tragic 77.4% |