Welsh vs Immigrants from Afghanistan In Labor Force | Age 20-64
COMPARE
Welsh
Immigrants from Afghanistan
In Labor Force | Age 20-64
In Labor Force | Age 20-64 Comparison
Welsh
Immigrants from Afghanistan
79.0%
IN LABOR FORCE | AGE 20-64
2.4/ 100
METRIC RATING
239th/ 347
METRIC RANK
80.2%
IN LABOR FORCE | AGE 20-64
97.9/ 100
METRIC RATING
75th/ 347
METRIC RANK
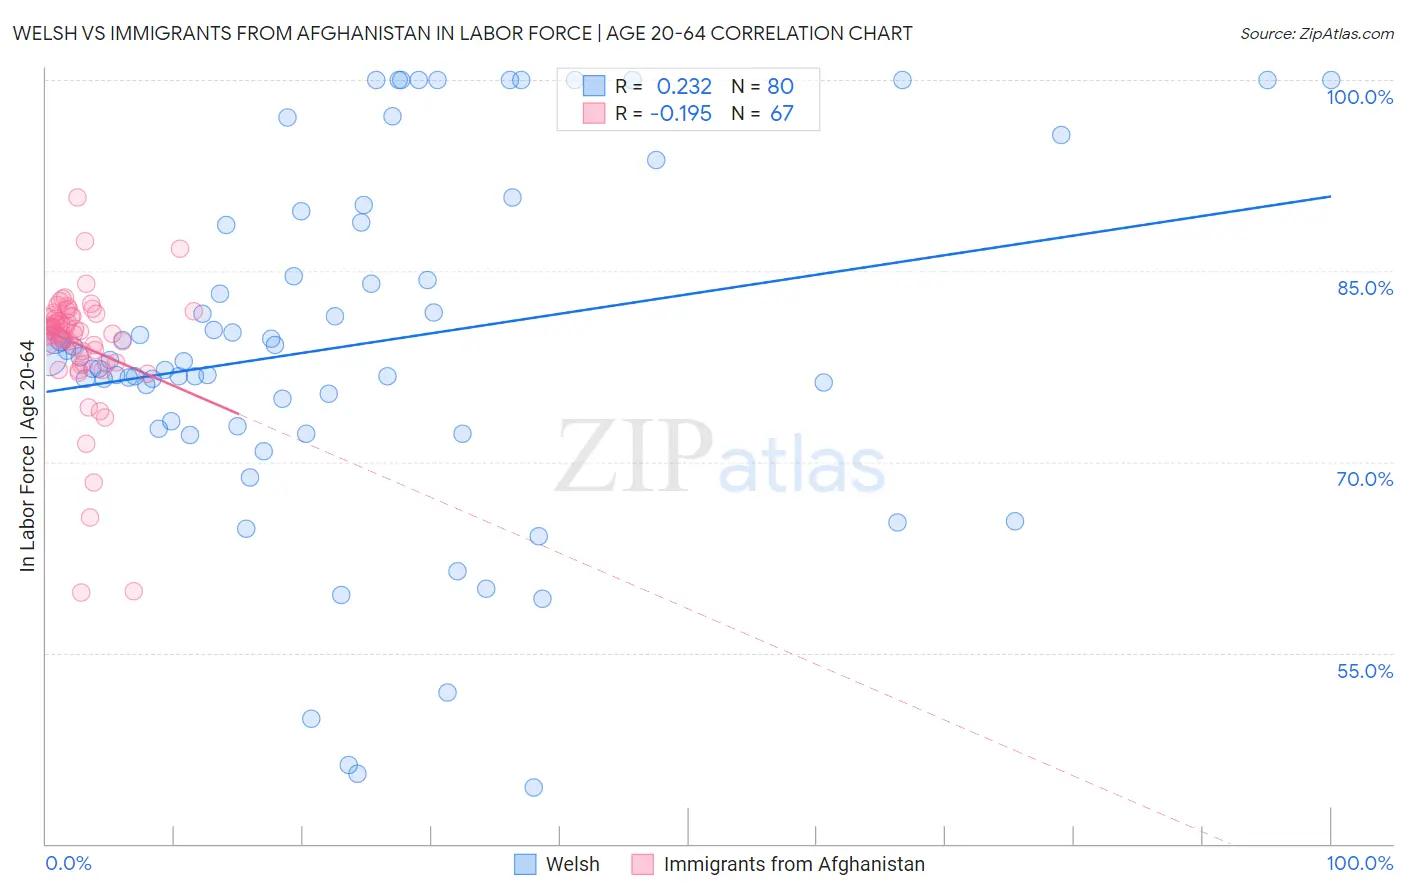
Welsh vs Immigrants from Afghanistan In Labor Force | Age 20-64 Correlation Chart
The statistical analysis conducted on geographies consisting of 528,606,062 people shows a weak positive correlation between the proportion of Welsh and labor force participation rate among population between the ages 20 and 64 in the United States with a correlation coefficient (R) of 0.232 and weighted average of 79.0%. Similarly, the statistical analysis conducted on geographies consisting of 147,645,979 people shows a poor negative correlation between the proportion of Immigrants from Afghanistan and labor force participation rate among population between the ages 20 and 64 in the United States with a correlation coefficient (R) of -0.195 and weighted average of 80.2%, a difference of 1.5%.
In Labor Force | Age 20-64 Correlation Summary
| Measurement | Welsh | Immigrants from Afghanistan |
| Minimum | 44.4% | 59.7% |
| Maximum | 100.0% | 90.8% |
| Range | 55.6% | 31.1% |
| Mean | 79.2% | 79.2% |
| Median | 78.1% | 80.3% |
| Interquartile 25% (IQ1) | 73.0% | 77.8% |
| Interquartile 75% (IQ3) | 88.7% | 81.5% |
| Interquartile Range (IQR) | 15.7% | 3.7% |
| Standard Deviation (Sample) | 13.7% | 5.0% |
| Standard Deviation (Population) | 13.6% | 5.0% |
Similar Demographics by In Labor Force | Age 20-64
Demographics Similar to Welsh by In Labor Force | Age 20-64
In terms of in labor force | age 20-64, the demographic groups most similar to Welsh are Trinidadian and Tobagonian (79.0%, a difference of 0.010%), Immigrants from Jamaica (79.0%, a difference of 0.020%), Samoan (79.0%, a difference of 0.040%), Immigrants from North America (79.0%, a difference of 0.040%), and Jamaican (78.9%, a difference of 0.040%).
| Demographics | Rating | Rank | In Labor Force | Age 20-64 |
| Guamanians/Chamorros | 4.5 /100 | #232 | Tragic 79.1% |
| Japanese | 4.0 /100 | #233 | Tragic 79.1% |
| Immigrants | Canada | 3.2 /100 | #234 | Tragic 79.0% |
| Tlingit-Haida | 3.2 /100 | #235 | Tragic 79.0% |
| Samoans | 2.9 /100 | #236 | Tragic 79.0% |
| Immigrants | North America | 2.9 /100 | #237 | Tragic 79.0% |
| Immigrants | Jamaica | 2.6 /100 | #238 | Tragic 79.0% |
| Welsh | 2.4 /100 | #239 | Tragic 79.0% |
| Trinidadians and Tobagonians | 2.3 /100 | #240 | Tragic 79.0% |
| Jamaicans | 2.0 /100 | #241 | Tragic 78.9% |
| Immigrants | Micronesia | 1.9 /100 | #242 | Tragic 78.9% |
| Immigrants | West Indies | 1.7 /100 | #243 | Tragic 78.9% |
| French | 1.5 /100 | #244 | Tragic 78.9% |
| Scottish | 1.3 /100 | #245 | Tragic 78.9% |
| Immigrants | Trinidad and Tobago | 1.1 /100 | #246 | Tragic 78.8% |
Demographics Similar to Immigrants from Afghanistan by In Labor Force | Age 20-64
In terms of in labor force | age 20-64, the demographic groups most similar to Immigrants from Afghanistan are Immigrants from Eastern Europe (80.2%, a difference of 0.010%), Egyptian (80.2%, a difference of 0.010%), Immigrants from Colombia (80.2%, a difference of 0.010%), Immigrants from Romania (80.2%, a difference of 0.010%), and Cypriot (80.2%, a difference of 0.020%).
| Demographics | Rating | Rank | In Labor Force | Age 20-64 |
| Bhutanese | 98.6 /100 | #68 | Exceptional 80.2% |
| Albanians | 98.6 /100 | #69 | Exceptional 80.2% |
| Immigrants | Turkey | 98.5 /100 | #70 | Exceptional 80.2% |
| Soviet Union | 98.5 /100 | #71 | Exceptional 80.2% |
| Eastern Europeans | 98.4 /100 | #72 | Exceptional 80.2% |
| Cypriots | 98.2 /100 | #73 | Exceptional 80.2% |
| Immigrants | Eastern Europe | 98.1 /100 | #74 | Exceptional 80.2% |
| Immigrants | Afghanistan | 97.9 /100 | #75 | Exceptional 80.2% |
| Egyptians | 97.8 /100 | #76 | Exceptional 80.2% |
| Immigrants | Colombia | 97.8 /100 | #77 | Exceptional 80.2% |
| Immigrants | Romania | 97.8 /100 | #78 | Exceptional 80.2% |
| Asians | 97.7 /100 | #79 | Exceptional 80.2% |
| Immigrants | Croatia | 97.6 /100 | #80 | Exceptional 80.1% |
| German Russians | 97.3 /100 | #81 | Exceptional 80.1% |
| Immigrants | Japan | 97.3 /100 | #82 | Exceptional 80.1% |