Welsh vs German Female Poverty Among 25-34 Year Olds
COMPARE
Welsh
German
Female Poverty Among 25-34 Year Olds
Female Poverty Among 25-34 Year Olds Comparison
Welsh
Germans
14.0%
FEMALE POVERTY AMONG 25-34 YEAR OLDS
17.2/ 100
METRIC RATING
202nd/ 347
METRIC RANK
13.6%
FEMALE POVERTY AMONG 25-34 YEAR OLDS
41.6/ 100
METRIC RATING
180th/ 347
METRIC RANK
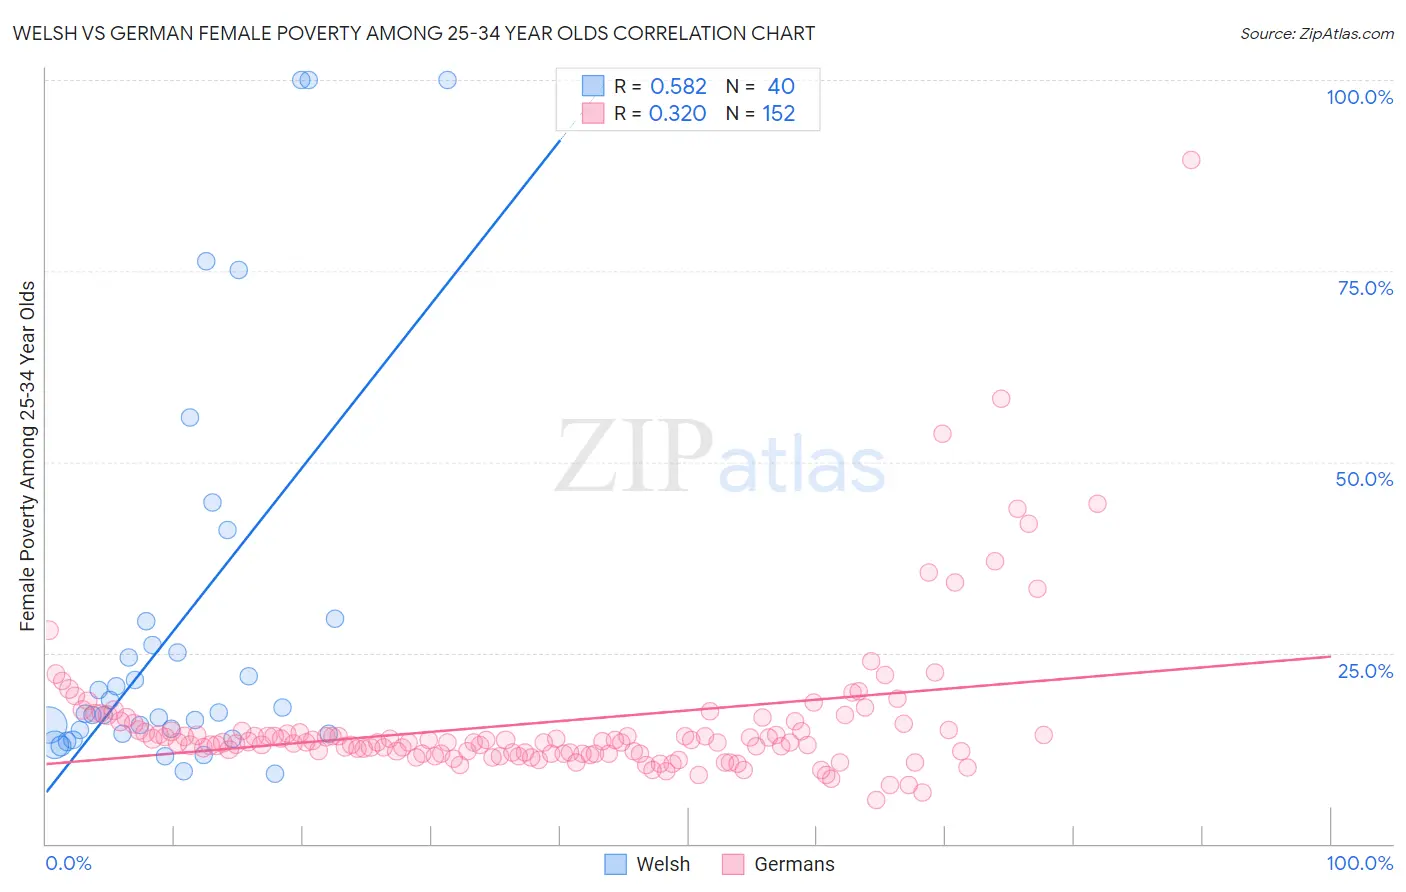
Welsh vs German Female Poverty Among 25-34 Year Olds Correlation Chart
The statistical analysis conducted on geographies consisting of 511,618,388 people shows a substantial positive correlation between the proportion of Welsh and poverty level among females between the ages 25 and 34 in the United States with a correlation coefficient (R) of 0.582 and weighted average of 14.0%. Similarly, the statistical analysis conducted on geographies consisting of 555,866,490 people shows a mild positive correlation between the proportion of Germans and poverty level among females between the ages 25 and 34 in the United States with a correlation coefficient (R) of 0.320 and weighted average of 13.6%, a difference of 2.5%.
Female Poverty Among 25-34 Year Olds Correlation Summary
| Measurement | Welsh | German |
| Minimum | 9.1% | 5.7% |
| Maximum | 100.0% | 89.5% |
| Range | 90.9% | 83.7% |
| Mean | 28.7% | 15.8% |
| Median | 17.1% | 13.3% |
| Interquartile 25% (IQ1) | 14.4% | 11.8% |
| Interquartile 75% (IQ3) | 27.5% | 14.9% |
| Interquartile Range (IQR) | 13.1% | 3.1% |
| Standard Deviation (Sample) | 25.7% | 9.9% |
| Standard Deviation (Population) | 25.4% | 9.8% |
Similar Demographics by Female Poverty Among 25-34 Year Olds
Demographics Similar to Welsh by Female Poverty Among 25-34 Year Olds
In terms of female poverty among 25-34 year olds, the demographic groups most similar to Welsh are Immigrants from Trinidad and Tobago (14.0%, a difference of 0.050%), Hmong (13.9%, a difference of 0.41%), Immigrants (14.0%, a difference of 0.41%), English (13.9%, a difference of 0.42%), and Immigrants from Germany (13.9%, a difference of 0.49%).
| Demographics | Rating | Rank | Female Poverty Among 25-34 Year Olds |
| Immigrants | Cambodia | 24.0 /100 | #195 | Fair 13.9% |
| Scottish | 23.6 /100 | #196 | Fair 13.9% |
| Immigrants | Saudi Arabia | 21.9 /100 | #197 | Fair 13.9% |
| Immigrants | Germany | 20.9 /100 | #198 | Fair 13.9% |
| English | 20.4 /100 | #199 | Fair 13.9% |
| Hmong | 20.3 /100 | #200 | Fair 13.9% |
| Immigrants | Trinidad and Tobago | 17.6 /100 | #201 | Poor 14.0% |
| Welsh | 17.2 /100 | #202 | Poor 14.0% |
| Immigrants | Immigrants | 14.5 /100 | #203 | Poor 14.0% |
| Hawaiians | 13.6 /100 | #204 | Poor 14.1% |
| Immigrants | Africa | 13.4 /100 | #205 | Poor 14.1% |
| Hungarians | 11.8 /100 | #206 | Poor 14.1% |
| Japanese | 11.7 /100 | #207 | Poor 14.1% |
| Immigrants | Panama | 11.6 /100 | #208 | Poor 14.1% |
| Guyanese | 8.6 /100 | #209 | Tragic 14.2% |
Demographics Similar to Germans by Female Poverty Among 25-34 Year Olds
In terms of female poverty among 25-34 year olds, the demographic groups most similar to Germans are Guamanian/Chamorro (13.6%, a difference of 0.010%), Immigrants from Venezuela (13.6%, a difference of 0.070%), Portuguese (13.6%, a difference of 0.11%), Immigrants from Eastern Africa (13.6%, a difference of 0.17%), and Canadian (13.6%, a difference of 0.23%).
| Demographics | Rating | Rank | Female Poverty Among 25-34 Year Olds |
| Kenyans | 51.8 /100 | #173 | Average 13.5% |
| Immigrants | Oceania | 50.0 /100 | #174 | Average 13.5% |
| Bermudans | 46.8 /100 | #175 | Average 13.6% |
| Yugoslavians | 45.0 /100 | #176 | Average 13.6% |
| Venezuelans | 44.6 /100 | #177 | Average 13.6% |
| Canadians | 44.3 /100 | #178 | Average 13.6% |
| Immigrants | Eastern Africa | 43.6 /100 | #179 | Average 13.6% |
| Germans | 41.6 /100 | #180 | Average 13.6% |
| Guamanians/Chamorros | 41.5 /100 | #181 | Average 13.6% |
| Immigrants | Venezuela | 40.7 /100 | #182 | Average 13.6% |
| Portuguese | 40.3 /100 | #183 | Average 13.6% |
| Czechoslovakians | 36.8 /100 | #184 | Fair 13.7% |
| Irish | 35.3 /100 | #185 | Fair 13.7% |
| Immigrants | Uruguay | 34.1 /100 | #186 | Fair 13.7% |
| Slovaks | 34.1 /100 | #187 | Fair 13.7% |