New Zealander vs Irish In Labor Force | Age > 16
COMPARE
New Zealander
Irish
In Labor Force | Age > 16
In Labor Force | Age > 16 Comparison
New Zealanders
Irish
65.7%
IN LABOR FORCE | AGE > 16
96.0/ 100
METRIC RATING
121st/ 347
METRIC RANK
64.1%
IN LABOR FORCE | AGE > 16
0.4/ 100
METRIC RATING
269th/ 347
METRIC RANK
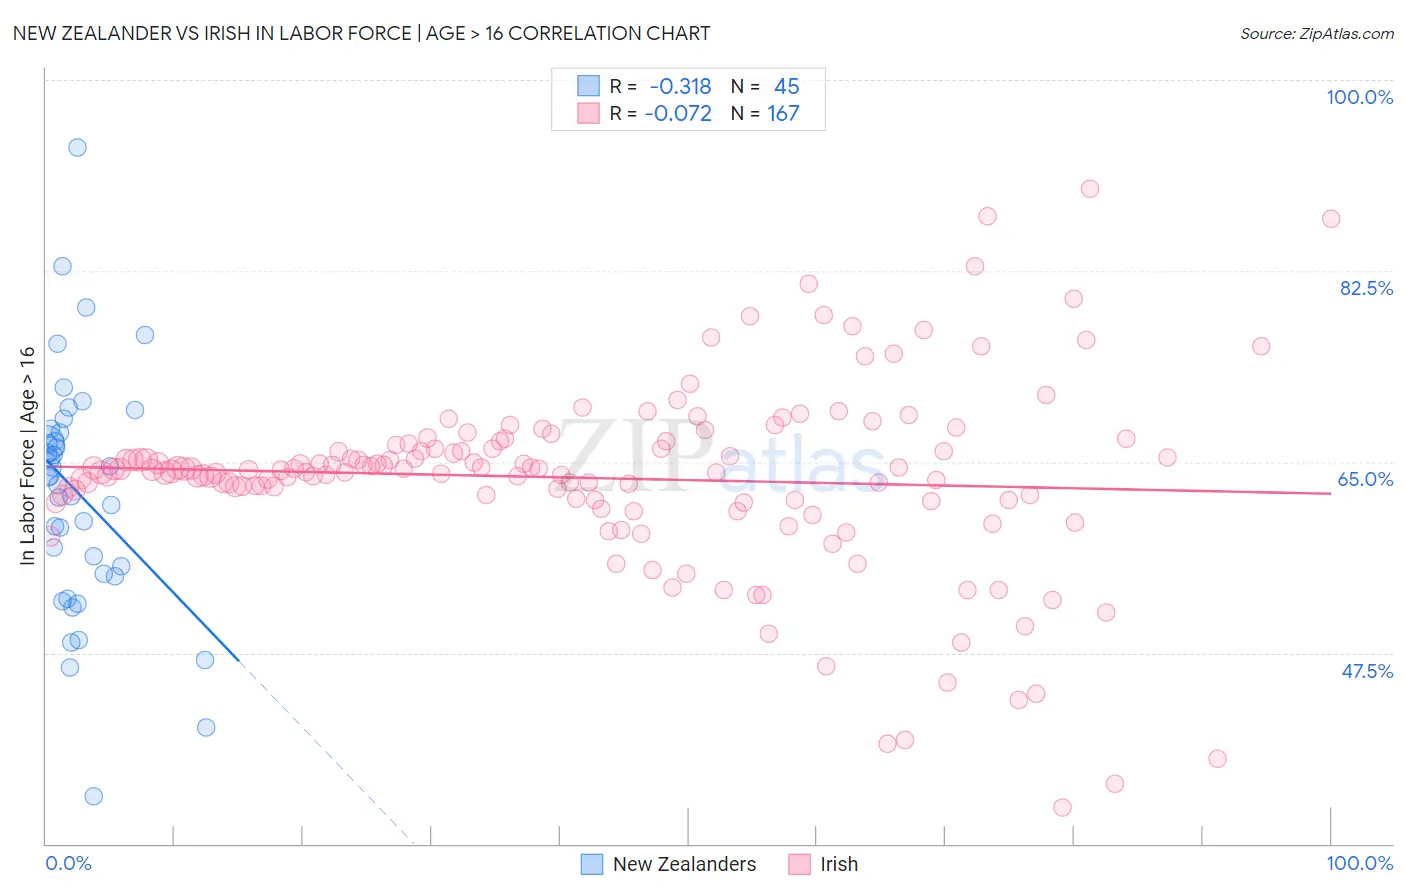
New Zealander vs Irish In Labor Force | Age > 16 Correlation Chart
The statistical analysis conducted on geographies consisting of 106,923,900 people shows a mild negative correlation between the proportion of New Zealanders and labor force participation rate among population ages 16 and over in the United States with a correlation coefficient (R) of -0.318 and weighted average of 65.7%. Similarly, the statistical analysis conducted on geographies consisting of 580,699,794 people shows a slight negative correlation between the proportion of Irish and labor force participation rate among population ages 16 and over in the United States with a correlation coefficient (R) of -0.072 and weighted average of 64.1%, a difference of 2.5%.
In Labor Force | Age > 16 Correlation Summary
| Measurement | New Zealander | Irish |
| Minimum | 34.3% | 33.3% |
| Maximum | 93.8% | 90.0% |
| Range | 59.5% | 56.7% |
| Mean | 62.0% | 63.5% |
| Median | 63.6% | 64.3% |
| Interquartile 25% (IQ1) | 54.7% | 61.5% |
| Interquartile 75% (IQ3) | 67.9% | 66.6% |
| Interquartile Range (IQR) | 13.2% | 5.1% |
| Standard Deviation (Sample) | 11.1% | 8.6% |
| Standard Deviation (Population) | 10.9% | 8.6% |
Similar Demographics by In Labor Force | Age > 16
Demographics Similar to New Zealanders by In Labor Force | Age > 16
In terms of in labor force | age > 16, the demographic groups most similar to New Zealanders are Immigrants from Ecuador (65.7%, a difference of 0.010%), Immigrants from Hong Kong (65.7%, a difference of 0.020%), Immigrants from France (65.7%, a difference of 0.030%), Immigrants from Iraq (65.7%, a difference of 0.040%), and Iraqi (65.7%, a difference of 0.040%).
| Demographics | Rating | Rank | In Labor Force | Age > 16 |
| Hondurans | 97.1 /100 | #114 | Exceptional 65.8% |
| Immigrants | Indonesia | 96.8 /100 | #115 | Exceptional 65.7% |
| Argentineans | 96.7 /100 | #116 | Exceptional 65.7% |
| Immigrants | Iran | 96.6 /100 | #117 | Exceptional 65.7% |
| Immigrants | Thailand | 96.6 /100 | #118 | Exceptional 65.7% |
| Immigrants | France | 96.4 /100 | #119 | Exceptional 65.7% |
| Immigrants | Hong Kong | 96.2 /100 | #120 | Exceptional 65.7% |
| New Zealanders | 96.0 /100 | #121 | Exceptional 65.7% |
| Immigrants | Ecuador | 95.9 /100 | #122 | Exceptional 65.7% |
| Immigrants | Iraq | 95.5 /100 | #123 | Exceptional 65.7% |
| Iraqis | 95.4 /100 | #124 | Exceptional 65.7% |
| Norwegians | 95.3 /100 | #125 | Exceptional 65.7% |
| Koreans | 95.3 /100 | #126 | Exceptional 65.7% |
| Immigrants | Eastern Asia | 94.9 /100 | #127 | Exceptional 65.7% |
| Ecuadorians | 94.7 /100 | #128 | Exceptional 65.6% |
Demographics Similar to Irish by In Labor Force | Age > 16
In terms of in labor force | age > 16, the demographic groups most similar to Irish are Guyanese (64.1%, a difference of 0.030%), Dominican (64.1%, a difference of 0.030%), Canadian (64.1%, a difference of 0.040%), Spaniard (64.1%, a difference of 0.040%), and Immigrants from England (64.2%, a difference of 0.050%).
| Demographics | Rating | Rank | In Labor Force | Age > 16 |
| Finns | 0.7 /100 | #262 | Tragic 64.2% |
| Bahamians | 0.6 /100 | #263 | Tragic 64.2% |
| Dutch | 0.6 /100 | #264 | Tragic 64.2% |
| Cubans | 0.5 /100 | #265 | Tragic 64.2% |
| Immigrants | England | 0.5 /100 | #266 | Tragic 64.2% |
| Canadians | 0.5 /100 | #267 | Tragic 64.1% |
| Spaniards | 0.5 /100 | #268 | Tragic 64.1% |
| Irish | 0.4 /100 | #269 | Tragic 64.1% |
| Guyanese | 0.4 /100 | #270 | Tragic 64.1% |
| Dominicans | 0.4 /100 | #271 | Tragic 64.1% |
| Native Hawaiians | 0.3 /100 | #272 | Tragic 64.1% |
| Hmong | 0.3 /100 | #273 | Tragic 64.1% |
| Immigrants | Cuba | 0.3 /100 | #274 | Tragic 64.1% |
| Mexicans | 0.3 /100 | #275 | Tragic 64.1% |
| French American Indians | 0.3 /100 | #276 | Tragic 64.1% |