Vietnamese vs Irish 8th Grade
COMPARE
Vietnamese
Irish
8th Grade
8th Grade Comparison
Vietnamese
Irish
93.5%
8TH GRADE
0.0/ 100
METRIC RATING
315th/ 347
METRIC RANK
97.3%
8TH GRADE
100.0/ 100
METRIC RATING
17th/ 347
METRIC RANK
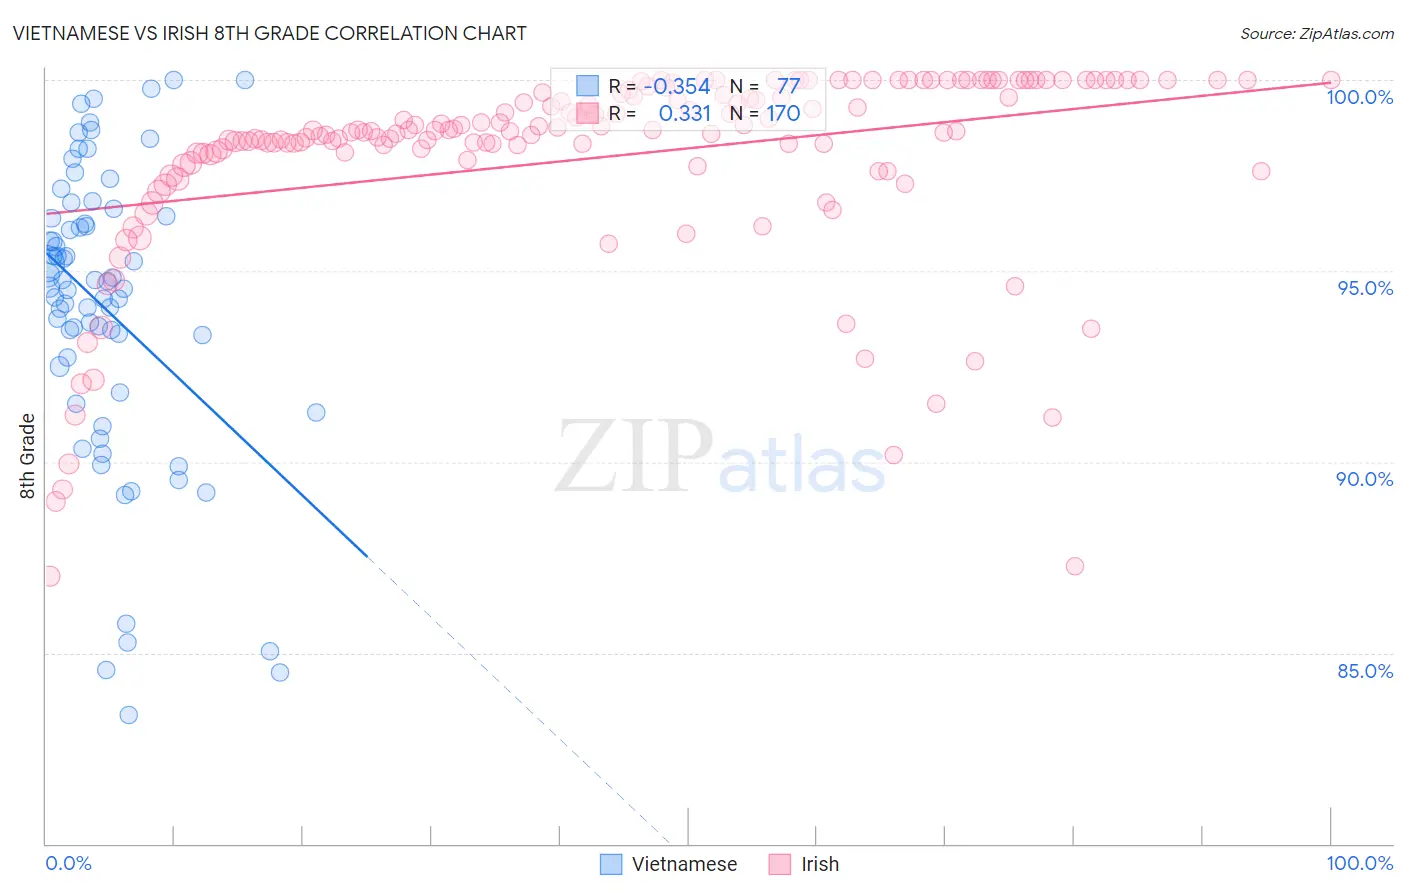
Vietnamese vs Irish 8th Grade Correlation Chart
The statistical analysis conducted on geographies consisting of 170,728,240 people shows a mild negative correlation between the proportion of Vietnamese and percentage of population with at least 8th grade education in the United States with a correlation coefficient (R) of -0.354 and weighted average of 93.5%. Similarly, the statistical analysis conducted on geographies consisting of 580,710,287 people shows a mild positive correlation between the proportion of Irish and percentage of population with at least 8th grade education in the United States with a correlation coefficient (R) of 0.331 and weighted average of 97.3%, a difference of 4.1%.
8th Grade Correlation Summary
| Measurement | Vietnamese | Irish |
| Minimum | 83.4% | 87.0% |
| Maximum | 100.0% | 100.0% |
| Range | 16.6% | 13.0% |
| Mean | 94.0% | 98.0% |
| Median | 94.6% | 98.7% |
| Interquartile 25% (IQ1) | 92.2% | 97.9% |
| Interquartile 75% (IQ3) | 96.4% | 99.7% |
| Interquartile Range (IQR) | 4.3% | 1.8% |
| Standard Deviation (Sample) | 3.8% | 2.6% |
| Standard Deviation (Population) | 3.8% | 2.6% |
Similar Demographics by 8th Grade
Demographics Similar to Vietnamese by 8th Grade
In terms of 8th grade, the demographic groups most similar to Vietnamese are Immigrants from Vietnam (93.5%, a difference of 0.010%), Immigrants from Caribbean (93.5%, a difference of 0.020%), Cape Verdean (93.5%, a difference of 0.050%), Japanese (93.6%, a difference of 0.090%), and Immigrants from Bangladesh (93.6%, a difference of 0.090%).
| Demographics | Rating | Rank | 8th Grade |
| Ecuadorians | 0.0 /100 | #308 | Tragic 93.6% |
| Immigrants | Immigrants | 0.0 /100 | #309 | Tragic 93.6% |
| Japanese | 0.0 /100 | #310 | Tragic 93.6% |
| Immigrants | Bangladesh | 0.0 /100 | #311 | Tragic 93.6% |
| Cape Verdeans | 0.0 /100 | #312 | Tragic 93.5% |
| Immigrants | Caribbean | 0.0 /100 | #313 | Tragic 93.5% |
| Immigrants | Vietnam | 0.0 /100 | #314 | Tragic 93.5% |
| Vietnamese | 0.0 /100 | #315 | Tragic 93.5% |
| Immigrants | Cambodia | 0.0 /100 | #316 | Tragic 93.3% |
| Immigrants | Ecuador | 0.0 /100 | #317 | Tragic 93.3% |
| Puerto Ricans | 0.0 /100 | #318 | Tragic 93.2% |
| Immigrants | Cuba | 0.0 /100 | #319 | Tragic 93.2% |
| Immigrants | Fiji | 0.0 /100 | #320 | Tragic 93.2% |
| Belizeans | 0.0 /100 | #321 | Tragic 93.1% |
| Nicaraguans | 0.0 /100 | #322 | Tragic 93.0% |
Demographics Similar to Irish by 8th Grade
In terms of 8th grade, the demographic groups most similar to Irish are Tlingit-Haida (97.3%, a difference of 0.010%), Lithuanian (97.3%, a difference of 0.010%), Scottish (97.3%, a difference of 0.020%), Pennsylvania German (97.3%, a difference of 0.040%), and Alaskan Athabascan (97.3%, a difference of 0.050%).
| Demographics | Rating | Rank | 8th Grade |
| Slovenes | 100.0 /100 | #10 | Exceptional 97.5% |
| Poles | 100.0 /100 | #11 | Exceptional 97.4% |
| Swedes | 100.0 /100 | #12 | Exceptional 97.4% |
| Alaskan Athabascans | 100.0 /100 | #13 | Exceptional 97.3% |
| English | 100.0 /100 | #14 | Exceptional 97.3% |
| Pennsylvania Germans | 100.0 /100 | #15 | Exceptional 97.3% |
| Tlingit-Haida | 100.0 /100 | #16 | Exceptional 97.3% |
| Irish | 100.0 /100 | #17 | Exceptional 97.3% |
| Lithuanians | 100.0 /100 | #18 | Exceptional 97.3% |
| Scottish | 100.0 /100 | #19 | Exceptional 97.3% |
| Croatians | 100.0 /100 | #20 | Exceptional 97.2% |
| Danes | 100.0 /100 | #21 | Exceptional 97.2% |
| Welsh | 100.0 /100 | #22 | Exceptional 97.2% |
| French Canadians | 100.0 /100 | #23 | Exceptional 97.2% |
| Scandinavians | 100.0 /100 | #24 | Exceptional 97.2% |