Venezuelan vs Paiute High School Diploma
COMPARE
Venezuelan
Paiute
High School Diploma
High School Diploma Comparison
Venezuelans
Paiute
89.1%
HIGH SCHOOL DIPLOMA
43.6/ 100
METRIC RATING
181st/ 347
METRIC RANK
86.4%
HIGH SCHOOL DIPLOMA
0.0/ 100
METRIC RATING
284th/ 347
METRIC RANK
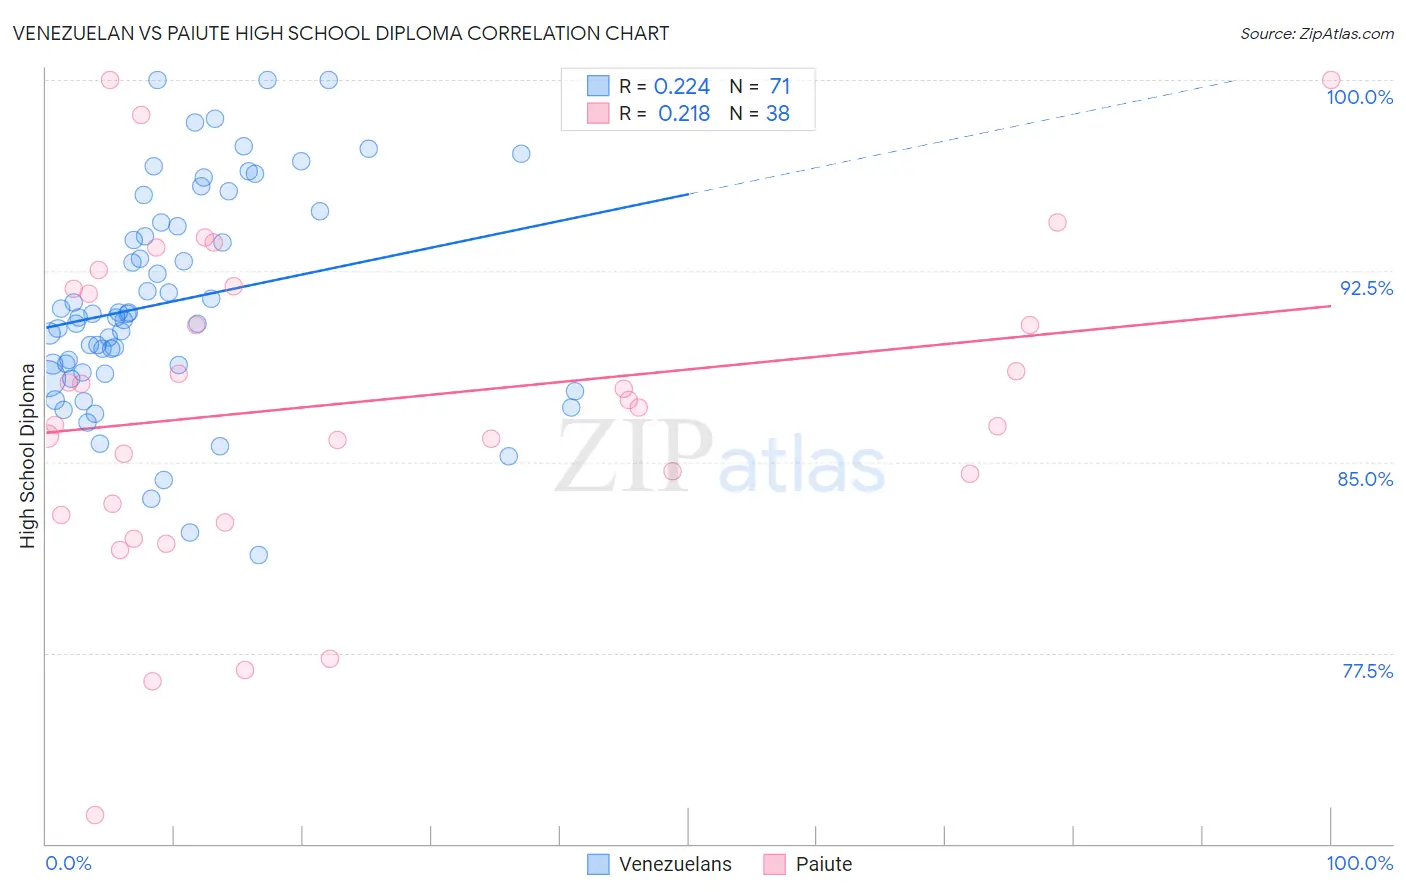
Venezuelan vs Paiute High School Diploma Correlation Chart
The statistical analysis conducted on geographies consisting of 306,323,638 people shows a weak positive correlation between the proportion of Venezuelans and percentage of population with at least high school diploma education in the United States with a correlation coefficient (R) of 0.224 and weighted average of 89.1%. Similarly, the statistical analysis conducted on geographies consisting of 58,404,248 people shows a weak positive correlation between the proportion of Paiute and percentage of population with at least high school diploma education in the United States with a correlation coefficient (R) of 0.218 and weighted average of 86.4%, a difference of 3.1%.
High School Diploma Correlation Summary
| Measurement | Venezuelan | Paiute |
| Minimum | 81.3% | 71.1% |
| Maximum | 100.0% | 100.0% |
| Range | 18.7% | 28.9% |
| Mean | 91.3% | 87.3% |
| Median | 90.7% | 87.3% |
| Interquartile 25% (IQ1) | 88.5% | 83.3% |
| Interquartile 75% (IQ3) | 94.4% | 91.8% |
| Interquartile Range (IQR) | 5.9% | 8.5% |
| Standard Deviation (Sample) | 4.3% | 6.4% |
| Standard Deviation (Population) | 4.2% | 6.3% |
Similar Demographics by High School Diploma
Demographics Similar to Venezuelans by High School Diploma
In terms of high school diploma, the demographic groups most similar to Venezuelans are Spaniard (89.1%, a difference of 0.0%), Bolivian (89.1%, a difference of 0.020%), Potawatomi (89.0%, a difference of 0.020%), American (89.1%, a difference of 0.050%), and Sudanese (89.1%, a difference of 0.070%).
| Demographics | Rating | Rank | High School Diploma |
| Hmong | 50.0 /100 | #174 | Average 89.1% |
| Immigrants | Western Asia | 49.0 /100 | #175 | Average 89.1% |
| Osage | 48.9 /100 | #176 | Average 89.1% |
| Sudanese | 48.5 /100 | #177 | Average 89.1% |
| Sierra Leoneans | 48.4 /100 | #178 | Average 89.1% |
| Americans | 47.2 /100 | #179 | Average 89.1% |
| Bolivians | 45.2 /100 | #180 | Average 89.1% |
| Venezuelans | 43.6 /100 | #181 | Average 89.1% |
| Spaniards | 43.4 /100 | #182 | Average 89.1% |
| Potawatomi | 42.5 /100 | #183 | Average 89.0% |
| Immigrants | Syria | 39.2 /100 | #184 | Fair 89.0% |
| Ethiopians | 37.0 /100 | #185 | Fair 89.0% |
| Immigrants | Eastern Africa | 35.8 /100 | #186 | Fair 88.9% |
| Guamanians/Chamorros | 35.5 /100 | #187 | Fair 88.9% |
| Immigrants | Sudan | 33.4 /100 | #188 | Fair 88.9% |
Demographics Similar to Paiute by High School Diploma
In terms of high school diploma, the demographic groups most similar to Paiute are Immigrants from Barbados (86.4%, a difference of 0.050%), Dutch West Indian (86.5%, a difference of 0.10%), Indonesian (86.5%, a difference of 0.15%), Pueblo (86.5%, a difference of 0.20%), and Immigrants from West Indies (86.2%, a difference of 0.20%).
| Demographics | Rating | Rank | High School Diploma |
| Barbadians | 0.1 /100 | #277 | Tragic 86.7% |
| Hopi | 0.1 /100 | #278 | Tragic 86.6% |
| Immigrants | Laos | 0.0 /100 | #279 | Tragic 86.6% |
| Pueblo | 0.0 /100 | #280 | Tragic 86.5% |
| Indonesians | 0.0 /100 | #281 | Tragic 86.5% |
| Dutch West Indians | 0.0 /100 | #282 | Tragic 86.5% |
| Immigrants | Barbados | 0.0 /100 | #283 | Tragic 86.4% |
| Paiute | 0.0 /100 | #284 | Tragic 86.4% |
| Immigrants | West Indies | 0.0 /100 | #285 | Tragic 86.2% |
| Immigrants | St. Vincent and the Grenadines | 0.0 /100 | #286 | Tragic 86.2% |
| Ute | 0.0 /100 | #287 | Tragic 86.2% |
| Immigrants | Vietnam | 0.0 /100 | #288 | Tragic 86.2% |
| Yup'ik | 0.0 /100 | #289 | Tragic 86.1% |
| Fijians | 0.0 /100 | #290 | Tragic 86.0% |
| Haitians | 0.0 /100 | #291 | Tragic 85.9% |