Ute vs Malaysian In Labor Force | Age 16-19
COMPARE
Ute
Malaysian
In Labor Force | Age 16-19
In Labor Force | Age 16-19 Comparison
Ute
Malaysians
37.1%
IN LABOR FORCE | AGE 16-19
75.7/ 100
METRIC RATING
158th/ 347
METRIC RANK
39.7%
IN LABOR FORCE | AGE 16-19
99.9/ 100
METRIC RATING
76th/ 347
METRIC RANK
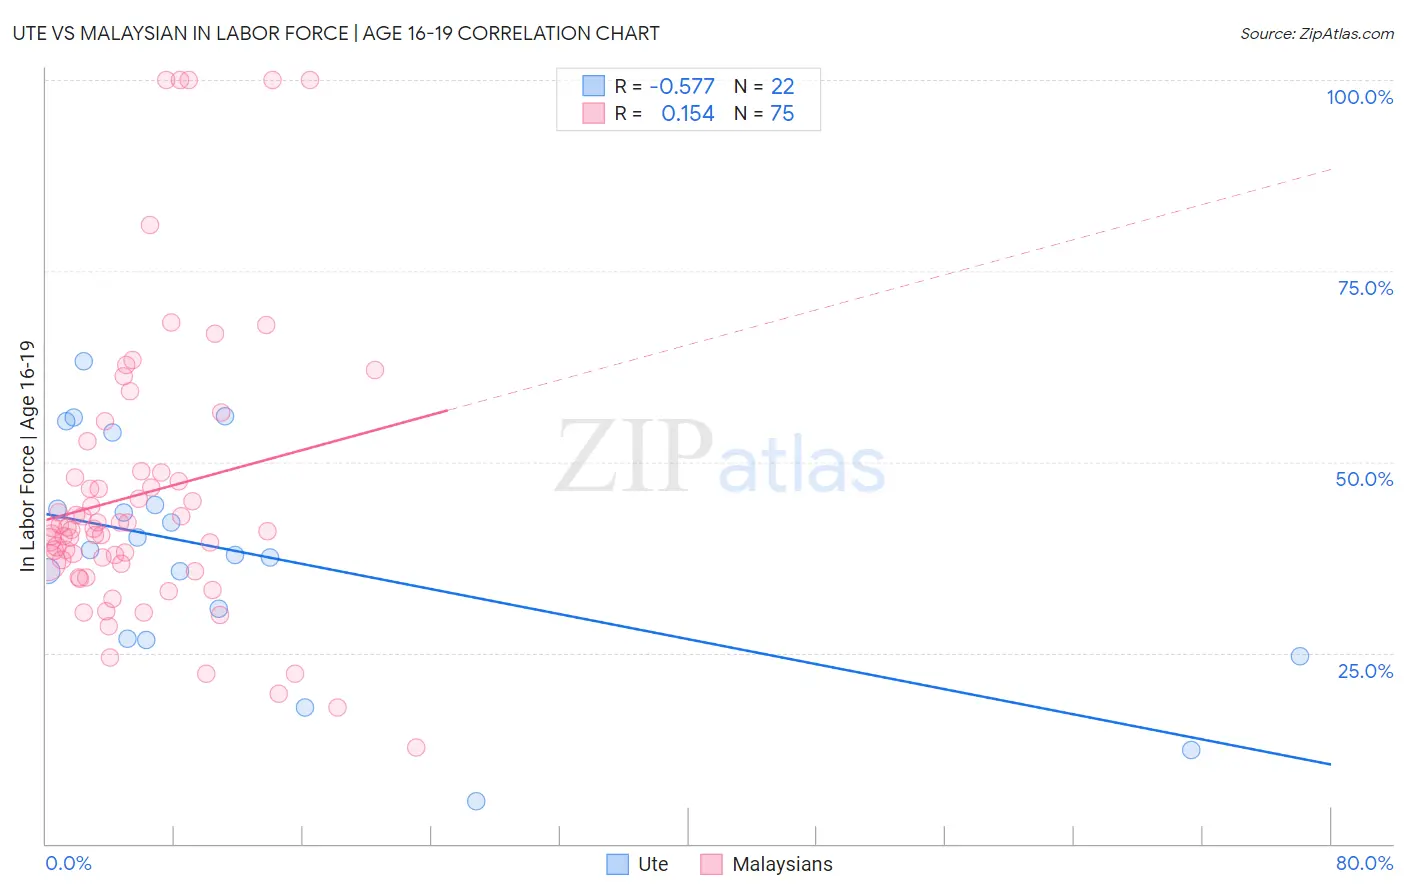
Ute vs Malaysian In Labor Force | Age 16-19 Correlation Chart
The statistical analysis conducted on geographies consisting of 55,645,372 people shows a substantial negative correlation between the proportion of Ute and labor force participation rate among population between the ages 16 and 19 in the United States with a correlation coefficient (R) of -0.577 and weighted average of 37.1%. Similarly, the statistical analysis conducted on geographies consisting of 225,967,692 people shows a poor positive correlation between the proportion of Malaysians and labor force participation rate among population between the ages 16 and 19 in the United States with a correlation coefficient (R) of 0.154 and weighted average of 39.7%, a difference of 7.1%.
In Labor Force | Age 16-19 Correlation Summary
| Measurement | Ute | Malaysian |
| Minimum | 5.6% | 12.6% |
| Maximum | 63.1% | 100.0% |
| Range | 57.5% | 87.4% |
| Mean | 37.6% | 45.8% |
| Median | 38.1% | 41.3% |
| Interquartile 25% (IQ1) | 26.8% | 36.7% |
| Interquartile 75% (IQ3) | 44.4% | 48.6% |
| Interquartile Range (IQR) | 17.6% | 11.9% |
| Standard Deviation (Sample) | 14.7% | 18.9% |
| Standard Deviation (Population) | 14.4% | 18.8% |
Similar Demographics by In Labor Force | Age 16-19
Demographics Similar to Ute by In Labor Force | Age 16-19
In terms of in labor force | age 16-19, the demographic groups most similar to Ute are Immigrants from Brazil (37.1%, a difference of 0.050%), Yaqui (37.1%, a difference of 0.080%), Immigrants from Saudi Arabia (37.0%, a difference of 0.12%), Cambodian (37.0%, a difference of 0.27%), and Kiowa (37.2%, a difference of 0.34%).
| Demographics | Rating | Rank | In Labor Force | Age 16-19 |
| Immigrants | Poland | 84.4 /100 | #151 | Excellent 37.3% |
| Immigrants | Sierra Leone | 83.6 /100 | #152 | Excellent 37.3% |
| Arapaho | 81.8 /100 | #153 | Excellent 37.3% |
| Immigrants | Bulgaria | 81.6 /100 | #154 | Excellent 37.3% |
| Immigrants | Lithuania | 80.7 /100 | #155 | Excellent 37.2% |
| Kiowa | 80.4 /100 | #156 | Excellent 37.2% |
| Immigrants | Brazil | 76.5 /100 | #157 | Good 37.1% |
| Ute | 75.7 /100 | #158 | Good 37.1% |
| Yaqui | 74.4 /100 | #159 | Good 37.1% |
| Immigrants | Saudi Arabia | 73.9 /100 | #160 | Good 37.0% |
| Cambodians | 71.5 /100 | #161 | Good 37.0% |
| Immigrants | Jordan | 69.5 /100 | #162 | Good 36.9% |
| Bermudans | 69.3 /100 | #163 | Good 36.9% |
| Immigrants | Kuwait | 68.9 /100 | #164 | Good 36.9% |
| Yakama | 66.9 /100 | #165 | Good 36.9% |
Demographics Similar to Malaysians by In Labor Force | Age 16-19
In terms of in labor force | age 16-19, the demographic groups most similar to Malaysians are Immigrants from Portugal (39.7%, a difference of 0.13%), French American Indian (39.8%, a difference of 0.27%), Hungarian (39.8%, a difference of 0.29%), Immigrants from Middle Africa (39.9%, a difference of 0.52%), and Austrian (39.5%, a difference of 0.52%).
| Demographics | Rating | Rank | In Labor Force | Age 16-19 |
| Potawatomi | 99.9 /100 | #69 | Exceptional 40.0% |
| Portuguese | 99.9 /100 | #70 | Exceptional 40.0% |
| Serbians | 99.9 /100 | #71 | Exceptional 39.9% |
| Iroquois | 99.9 /100 | #72 | Exceptional 39.9% |
| Immigrants | Middle Africa | 99.9 /100 | #73 | Exceptional 39.9% |
| Hungarians | 99.9 /100 | #74 | Exceptional 39.8% |
| French American Indians | 99.9 /100 | #75 | Exceptional 39.8% |
| Malaysians | 99.9 /100 | #76 | Exceptional 39.7% |
| Immigrants | Portugal | 99.9 /100 | #77 | Exceptional 39.7% |
| Austrians | 99.8 /100 | #78 | Exceptional 39.5% |
| Marshallese | 99.8 /100 | #79 | Exceptional 39.5% |
| Immigrants | Iraq | 99.8 /100 | #80 | Exceptional 39.4% |
| Shoshone | 99.7 /100 | #81 | Exceptional 39.3% |
| Basques | 99.7 /100 | #82 | Exceptional 39.3% |
| Spanish | 99.7 /100 | #83 | Exceptional 39.3% |