Scandinavian vs Malaysian In Labor Force | Age 16-19
COMPARE
Scandinavian
Malaysian
In Labor Force | Age 16-19
In Labor Force | Age 16-19 Comparison
Scandinavians
Malaysians
43.6%
IN LABOR FORCE | AGE 16-19
100.0/ 100
METRIC RATING
17th/ 347
METRIC RANK
39.7%
IN LABOR FORCE | AGE 16-19
99.9/ 100
METRIC RATING
76th/ 347
METRIC RANK
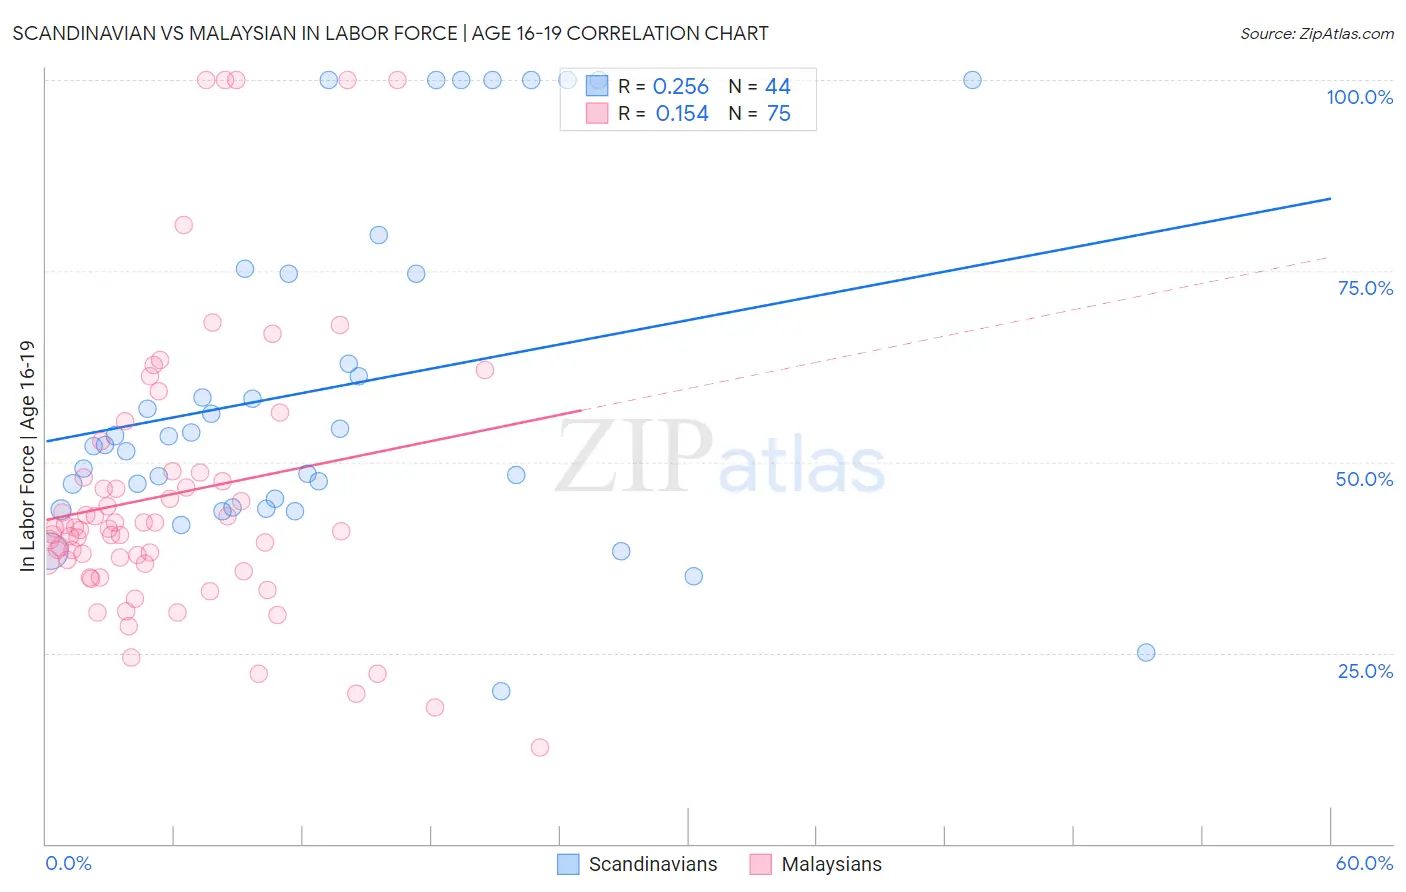
Scandinavian vs Malaysian In Labor Force | Age 16-19 Correlation Chart
The statistical analysis conducted on geographies consisting of 471,147,409 people shows a weak positive correlation between the proportion of Scandinavians and labor force participation rate among population between the ages 16 and 19 in the United States with a correlation coefficient (R) of 0.256 and weighted average of 43.6%. Similarly, the statistical analysis conducted on geographies consisting of 225,967,692 people shows a poor positive correlation between the proportion of Malaysians and labor force participation rate among population between the ages 16 and 19 in the United States with a correlation coefficient (R) of 0.154 and weighted average of 39.7%, a difference of 9.8%.
In Labor Force | Age 16-19 Correlation Summary
| Measurement | Scandinavian | Malaysian |
| Minimum | 20.0% | 12.6% |
| Maximum | 100.0% | 100.0% |
| Range | 80.0% | 87.4% |
| Mean | 59.7% | 45.8% |
| Median | 52.8% | 41.3% |
| Interquartile 25% (IQ1) | 44.6% | 36.7% |
| Interquartile 75% (IQ3) | 74.6% | 48.6% |
| Interquartile Range (IQR) | 30.0% | 11.9% |
| Standard Deviation (Sample) | 22.4% | 18.9% |
| Standard Deviation (Population) | 22.1% | 18.8% |
Similar Demographics by In Labor Force | Age 16-19
Demographics Similar to Scandinavians by In Labor Force | Age 16-19
In terms of in labor force | age 16-19, the demographic groups most similar to Scandinavians are Czech (43.6%, a difference of 0.070%), French Canadian (43.6%, a difference of 0.070%), Slovene (43.7%, a difference of 0.17%), Chippewa (43.8%, a difference of 0.43%), and Dutch (43.8%, a difference of 0.53%).
| Demographics | Rating | Rank | In Labor Force | Age 16-19 |
| Germans | 100.0 /100 | #10 | Exceptional 44.2% |
| Swedes | 100.0 /100 | #11 | Exceptional 44.1% |
| Finns | 100.0 /100 | #12 | Exceptional 43.9% |
| Dutch | 100.0 /100 | #13 | Exceptional 43.8% |
| Chippewa | 100.0 /100 | #14 | Exceptional 43.8% |
| Slovenes | 100.0 /100 | #15 | Exceptional 43.7% |
| Czechs | 100.0 /100 | #16 | Exceptional 43.6% |
| Scandinavians | 100.0 /100 | #17 | Exceptional 43.6% |
| French Canadians | 100.0 /100 | #18 | Exceptional 43.6% |
| Belgians | 100.0 /100 | #19 | Exceptional 43.4% |
| Swiss | 100.0 /100 | #20 | Exceptional 43.3% |
| Ottawa | 100.0 /100 | #21 | Exceptional 43.0% |
| Sudanese | 100.0 /100 | #22 | Exceptional 42.9% |
| Slovaks | 100.0 /100 | #23 | Exceptional 42.6% |
| Bangladeshis | 100.0 /100 | #24 | Exceptional 42.5% |
Demographics Similar to Malaysians by In Labor Force | Age 16-19
In terms of in labor force | age 16-19, the demographic groups most similar to Malaysians are Immigrants from Portugal (39.7%, a difference of 0.13%), French American Indian (39.8%, a difference of 0.27%), Hungarian (39.8%, a difference of 0.29%), Immigrants from Middle Africa (39.9%, a difference of 0.52%), and Austrian (39.5%, a difference of 0.52%).
| Demographics | Rating | Rank | In Labor Force | Age 16-19 |
| Potawatomi | 99.9 /100 | #69 | Exceptional 40.0% |
| Portuguese | 99.9 /100 | #70 | Exceptional 40.0% |
| Serbians | 99.9 /100 | #71 | Exceptional 39.9% |
| Iroquois | 99.9 /100 | #72 | Exceptional 39.9% |
| Immigrants | Middle Africa | 99.9 /100 | #73 | Exceptional 39.9% |
| Hungarians | 99.9 /100 | #74 | Exceptional 39.8% |
| French American Indians | 99.9 /100 | #75 | Exceptional 39.8% |
| Malaysians | 99.9 /100 | #76 | Exceptional 39.7% |
| Immigrants | Portugal | 99.9 /100 | #77 | Exceptional 39.7% |
| Austrians | 99.8 /100 | #78 | Exceptional 39.5% |
| Marshallese | 99.8 /100 | #79 | Exceptional 39.5% |
| Immigrants | Iraq | 99.8 /100 | #80 | Exceptional 39.4% |
| Shoshone | 99.7 /100 | #81 | Exceptional 39.3% |
| Basques | 99.7 /100 | #82 | Exceptional 39.3% |
| Spanish | 99.7 /100 | #83 | Exceptional 39.3% |