Ute vs Mongolian In Labor Force | Age 16-19
COMPARE
Ute
Mongolian
In Labor Force | Age 16-19
In Labor Force | Age 16-19 Comparison
Ute
Mongolians
37.1%
IN LABOR FORCE | AGE 16-19
75.7/ 100
METRIC RATING
158th/ 347
METRIC RANK
35.3%
IN LABOR FORCE | AGE 16-19
5.7/ 100
METRIC RATING
227th/ 347
METRIC RANK
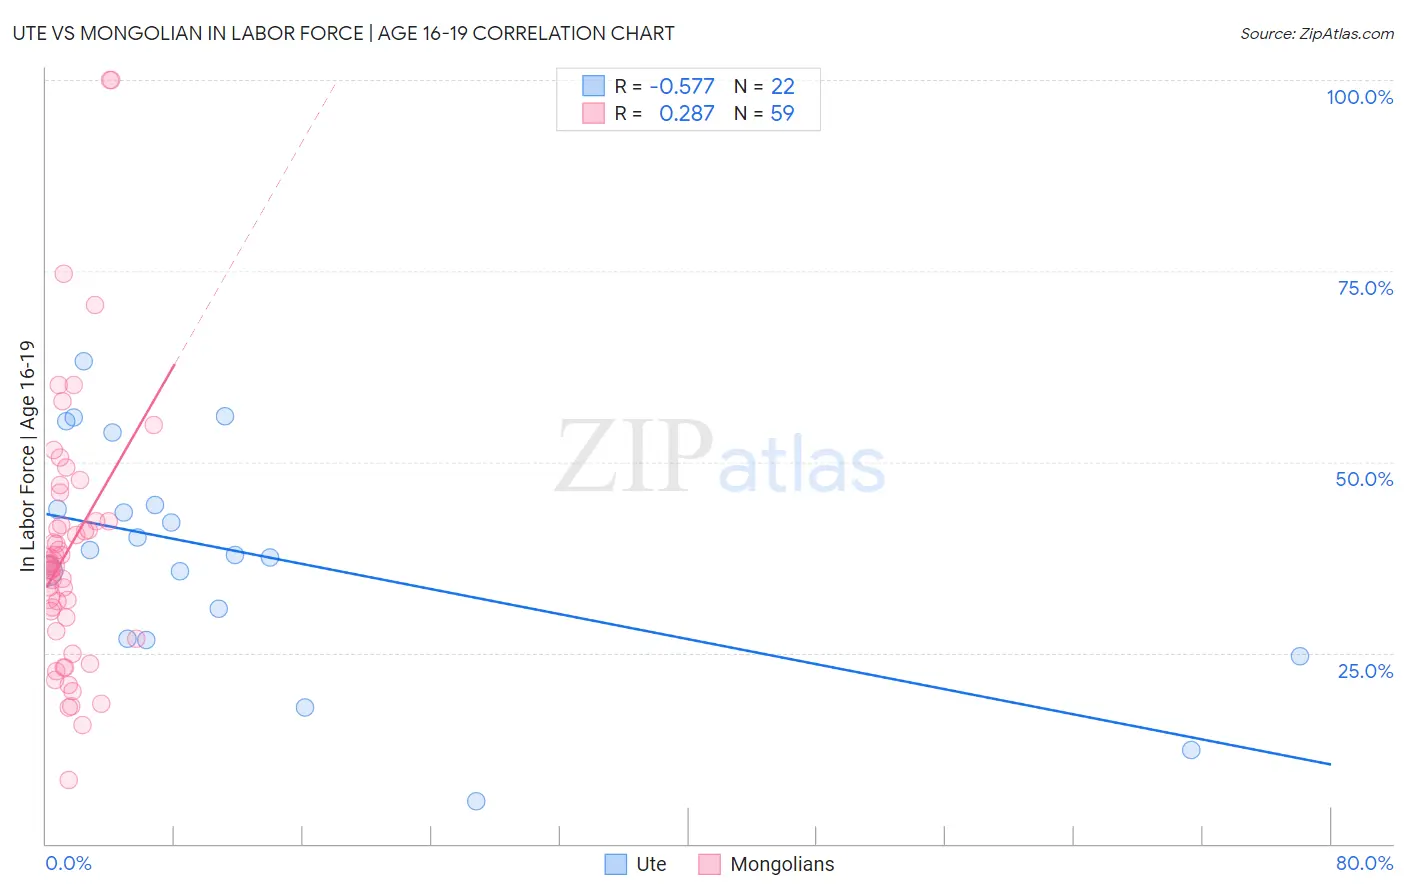
Ute vs Mongolian In Labor Force | Age 16-19 Correlation Chart
The statistical analysis conducted on geographies consisting of 55,645,372 people shows a substantial negative correlation between the proportion of Ute and labor force participation rate among population between the ages 16 and 19 in the United States with a correlation coefficient (R) of -0.577 and weighted average of 37.1%. Similarly, the statistical analysis conducted on geographies consisting of 140,345,007 people shows a weak positive correlation between the proportion of Mongolians and labor force participation rate among population between the ages 16 and 19 in the United States with a correlation coefficient (R) of 0.287 and weighted average of 35.3%, a difference of 5.1%.
In Labor Force | Age 16-19 Correlation Summary
| Measurement | Ute | Mongolian |
| Minimum | 5.6% | 8.3% |
| Maximum | 63.1% | 100.0% |
| Range | 57.5% | 91.7% |
| Mean | 37.6% | 38.6% |
| Median | 38.1% | 36.4% |
| Interquartile 25% (IQ1) | 26.8% | 27.9% |
| Interquartile 75% (IQ3) | 44.4% | 42.3% |
| Interquartile Range (IQR) | 17.6% | 14.4% |
| Standard Deviation (Sample) | 14.7% | 17.5% |
| Standard Deviation (Population) | 14.4% | 17.3% |
Similar Demographics by In Labor Force | Age 16-19
Demographics Similar to Ute by In Labor Force | Age 16-19
In terms of in labor force | age 16-19, the demographic groups most similar to Ute are Immigrants from Brazil (37.1%, a difference of 0.050%), Yaqui (37.1%, a difference of 0.080%), Immigrants from Saudi Arabia (37.0%, a difference of 0.12%), Cambodian (37.0%, a difference of 0.27%), and Kiowa (37.2%, a difference of 0.34%).
| Demographics | Rating | Rank | In Labor Force | Age 16-19 |
| Immigrants | Poland | 84.4 /100 | #151 | Excellent 37.3% |
| Immigrants | Sierra Leone | 83.6 /100 | #152 | Excellent 37.3% |
| Arapaho | 81.8 /100 | #153 | Excellent 37.3% |
| Immigrants | Bulgaria | 81.6 /100 | #154 | Excellent 37.3% |
| Immigrants | Lithuania | 80.7 /100 | #155 | Excellent 37.2% |
| Kiowa | 80.4 /100 | #156 | Excellent 37.2% |
| Immigrants | Brazil | 76.5 /100 | #157 | Good 37.1% |
| Ute | 75.7 /100 | #158 | Good 37.1% |
| Yaqui | 74.4 /100 | #159 | Good 37.1% |
| Immigrants | Saudi Arabia | 73.9 /100 | #160 | Good 37.0% |
| Cambodians | 71.5 /100 | #161 | Good 37.0% |
| Immigrants | Jordan | 69.5 /100 | #162 | Good 36.9% |
| Bermudans | 69.3 /100 | #163 | Good 36.9% |
| Immigrants | Kuwait | 68.9 /100 | #164 | Good 36.9% |
| Yakama | 66.9 /100 | #165 | Good 36.9% |
Demographics Similar to Mongolians by In Labor Force | Age 16-19
In terms of in labor force | age 16-19, the demographic groups most similar to Mongolians are Immigrants from Guatemala (35.3%, a difference of 0.010%), Immigrants from Senegal (35.3%, a difference of 0.050%), Immigrants from Belgium (35.3%, a difference of 0.10%), Honduran (35.3%, a difference of 0.18%), and Immigrants from Lebanon (35.2%, a difference of 0.18%).
| Demographics | Rating | Rank | In Labor Force | Age 16-19 |
| Immigrants | Bahamas | 8.3 /100 | #220 | Tragic 35.5% |
| Turks | 7.3 /100 | #221 | Tragic 35.4% |
| Immigrants | Ghana | 7.3 /100 | #222 | Tragic 35.4% |
| Ghanaians | 6.5 /100 | #223 | Tragic 35.3% |
| Hondurans | 6.5 /100 | #224 | Tragic 35.3% |
| Immigrants | Belgium | 6.1 /100 | #225 | Tragic 35.3% |
| Immigrants | Guatemala | 5.7 /100 | #226 | Tragic 35.3% |
| Mongolians | 5.7 /100 | #227 | Tragic 35.3% |
| Immigrants | Senegal | 5.5 /100 | #228 | Tragic 35.3% |
| Immigrants | Lebanon | 5.0 /100 | #229 | Tragic 35.2% |
| Immigrants | Honduras | 4.9 /100 | #230 | Tragic 35.2% |
| Immigrants | Syria | 4.5 /100 | #231 | Tragic 35.2% |
| Immigrants | Kazakhstan | 4.5 /100 | #232 | Tragic 35.2% |
| Immigrants | France | 4.3 /100 | #233 | Tragic 35.1% |
| Immigrants | Mexico | 4.2 /100 | #234 | Tragic 35.1% |