Immigrants from Hong Kong vs Malaysian In Labor Force | Age 16-19
COMPARE
Immigrants from Hong Kong
Malaysian
In Labor Force | Age 16-19
In Labor Force | Age 16-19 Comparison
Immigrants from Hong Kong
Malaysians
30.5%
IN LABOR FORCE | AGE 16-19
0.0/ 100
METRIC RATING
333rd/ 347
METRIC RANK
39.7%
IN LABOR FORCE | AGE 16-19
99.9/ 100
METRIC RATING
76th/ 347
METRIC RANK
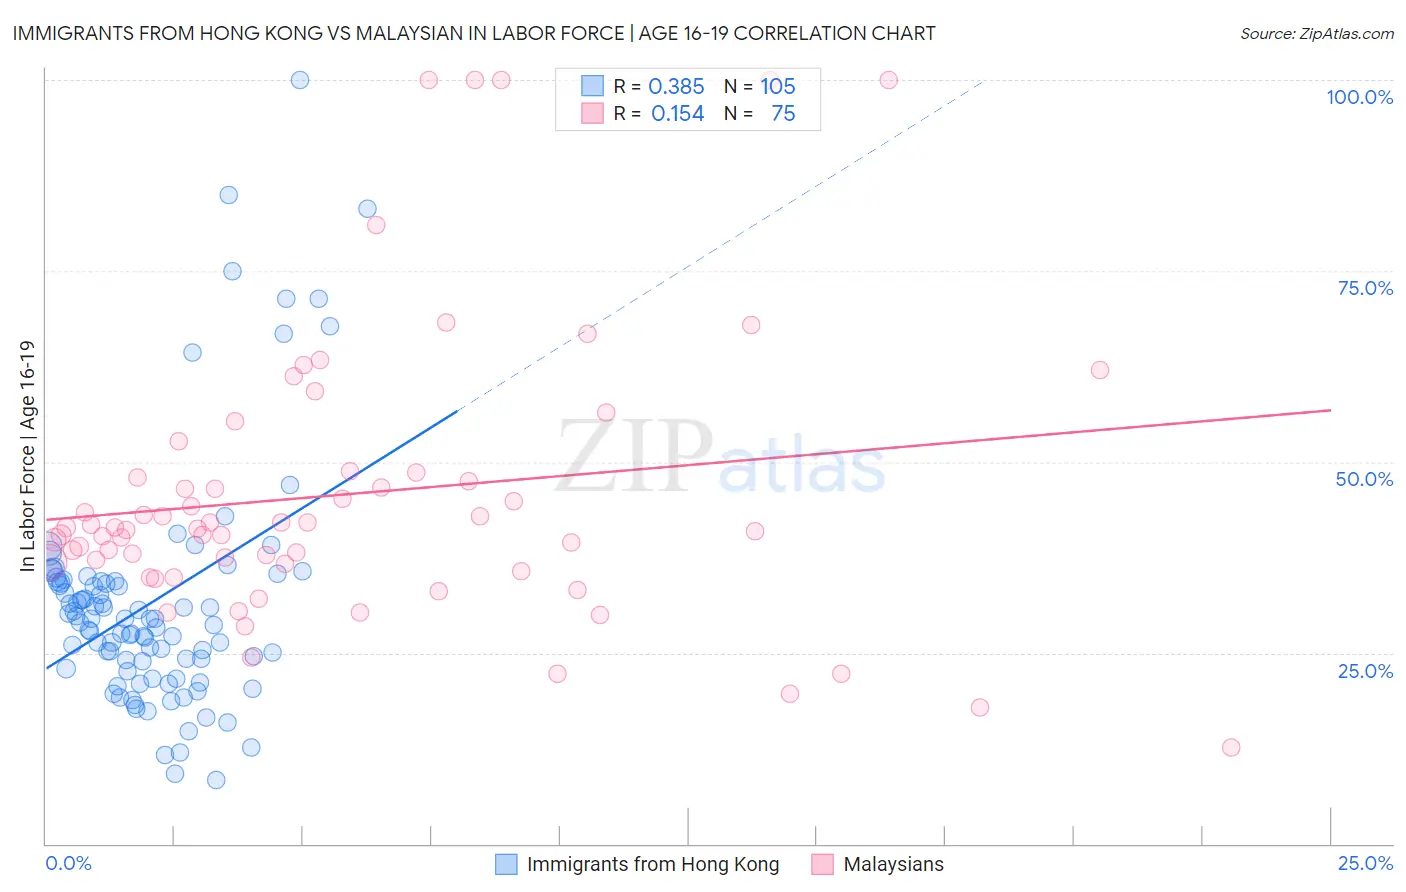
Immigrants from Hong Kong vs Malaysian In Labor Force | Age 16-19 Correlation Chart
The statistical analysis conducted on geographies consisting of 253,714,019 people shows a mild positive correlation between the proportion of Immigrants from Hong Kong and labor force participation rate among population between the ages 16 and 19 in the United States with a correlation coefficient (R) of 0.385 and weighted average of 30.5%. Similarly, the statistical analysis conducted on geographies consisting of 225,967,692 people shows a poor positive correlation between the proportion of Malaysians and labor force participation rate among population between the ages 16 and 19 in the United States with a correlation coefficient (R) of 0.154 and weighted average of 39.7%, a difference of 30.4%.
In Labor Force | Age 16-19 Correlation Summary
| Measurement | Immigrants from Hong Kong | Malaysian |
| Minimum | 8.3% | 12.6% |
| Maximum | 100.0% | 100.0% |
| Range | 91.7% | 87.4% |
| Mean | 31.7% | 45.8% |
| Median | 29.4% | 41.3% |
| Interquartile 25% (IQ1) | 23.4% | 36.7% |
| Interquartile 75% (IQ3) | 34.4% | 48.6% |
| Interquartile Range (IQR) | 11.0% | 11.9% |
| Standard Deviation (Sample) | 15.8% | 18.9% |
| Standard Deviation (Population) | 15.7% | 18.8% |
Similar Demographics by In Labor Force | Age 16-19
Demographics Similar to Immigrants from Hong Kong by In Labor Force | Age 16-19
In terms of in labor force | age 16-19, the demographic groups most similar to Immigrants from Hong Kong are Immigrants from Israel (30.5%, a difference of 0.020%), Puerto Rican (30.3%, a difference of 0.42%), Immigrants from Cuba (30.2%, a difference of 0.75%), Immigrants from Trinidad and Tobago (30.2%, a difference of 1.0%), and Immigrants from Bangladesh (30.0%, a difference of 1.4%).
| Demographics | Rating | Rank | In Labor Force | Age 16-19 |
| Immigrants | Dominican Republic | 0.0 /100 | #326 | Tragic 31.1% |
| Immigrants | Taiwan | 0.0 /100 | #327 | Tragic 31.0% |
| Immigrants | Ecuador | 0.0 /100 | #328 | Tragic 31.0% |
| Barbadians | 0.0 /100 | #329 | Tragic 31.0% |
| Lumbee | 0.0 /100 | #330 | Tragic 31.0% |
| Trinidadians and Tobagonians | 0.0 /100 | #331 | Tragic 30.9% |
| Immigrants | Israel | 0.0 /100 | #332 | Tragic 30.5% |
| Immigrants | Hong Kong | 0.0 /100 | #333 | Tragic 30.5% |
| Puerto Ricans | 0.0 /100 | #334 | Tragic 30.3% |
| Immigrants | Cuba | 0.0 /100 | #335 | Tragic 30.2% |
| Immigrants | Trinidad and Tobago | 0.0 /100 | #336 | Tragic 30.2% |
| Immigrants | Bangladesh | 0.0 /100 | #337 | Tragic 30.0% |
| Vietnamese | 0.0 /100 | #338 | Tragic 29.6% |
| Immigrants | Uzbekistan | 0.0 /100 | #339 | Tragic 29.2% |
| British West Indians | 0.0 /100 | #340 | Tragic 29.1% |
Demographics Similar to Malaysians by In Labor Force | Age 16-19
In terms of in labor force | age 16-19, the demographic groups most similar to Malaysians are Immigrants from Portugal (39.7%, a difference of 0.13%), French American Indian (39.8%, a difference of 0.27%), Hungarian (39.8%, a difference of 0.29%), Immigrants from Middle Africa (39.9%, a difference of 0.52%), and Austrian (39.5%, a difference of 0.52%).
| Demographics | Rating | Rank | In Labor Force | Age 16-19 |
| Potawatomi | 99.9 /100 | #69 | Exceptional 40.0% |
| Portuguese | 99.9 /100 | #70 | Exceptional 40.0% |
| Serbians | 99.9 /100 | #71 | Exceptional 39.9% |
| Iroquois | 99.9 /100 | #72 | Exceptional 39.9% |
| Immigrants | Middle Africa | 99.9 /100 | #73 | Exceptional 39.9% |
| Hungarians | 99.9 /100 | #74 | Exceptional 39.8% |
| French American Indians | 99.9 /100 | #75 | Exceptional 39.8% |
| Malaysians | 99.9 /100 | #76 | Exceptional 39.7% |
| Immigrants | Portugal | 99.9 /100 | #77 | Exceptional 39.7% |
| Austrians | 99.8 /100 | #78 | Exceptional 39.5% |
| Marshallese | 99.8 /100 | #79 | Exceptional 39.5% |
| Immigrants | Iraq | 99.8 /100 | #80 | Exceptional 39.4% |
| Shoshone | 99.7 /100 | #81 | Exceptional 39.3% |
| Basques | 99.7 /100 | #82 | Exceptional 39.3% |
| Spanish | 99.7 /100 | #83 | Exceptional 39.3% |