Ute vs Burmese In Labor Force | Age 16-19
COMPARE
Ute
Burmese
In Labor Force | Age 16-19
In Labor Force | Age 16-19 Comparison
Ute
Burmese
37.1%
IN LABOR FORCE | AGE 16-19
75.7/ 100
METRIC RATING
158th/ 347
METRIC RANK
34.5%
IN LABOR FORCE | AGE 16-19
1.1/ 100
METRIC RATING
263rd/ 347
METRIC RANK
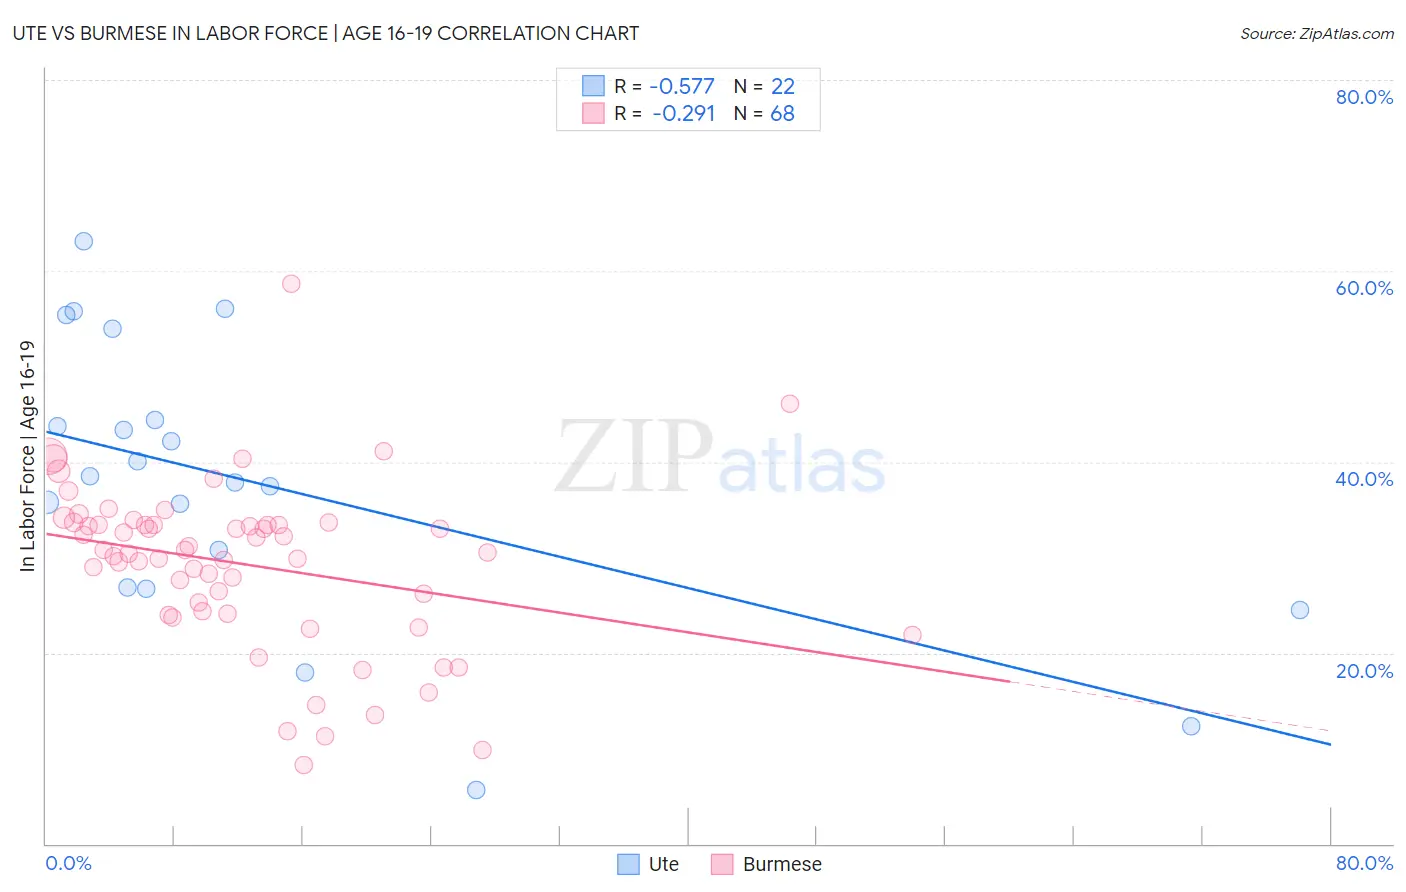
Ute vs Burmese In Labor Force | Age 16-19 Correlation Chart
The statistical analysis conducted on geographies consisting of 55,645,372 people shows a substantial negative correlation between the proportion of Ute and labor force participation rate among population between the ages 16 and 19 in the United States with a correlation coefficient (R) of -0.577 and weighted average of 37.1%. Similarly, the statistical analysis conducted on geographies consisting of 464,488,872 people shows a weak negative correlation between the proportion of Burmese and labor force participation rate among population between the ages 16 and 19 in the United States with a correlation coefficient (R) of -0.291 and weighted average of 34.5%, a difference of 7.5%.
In Labor Force | Age 16-19 Correlation Summary
| Measurement | Ute | Burmese |
| Minimum | 5.6% | 8.3% |
| Maximum | 63.1% | 58.6% |
| Range | 57.5% | 50.3% |
| Mean | 37.6% | 29.3% |
| Median | 38.1% | 30.7% |
| Interquartile 25% (IQ1) | 26.8% | 24.3% |
| Interquartile 75% (IQ3) | 44.4% | 33.4% |
| Interquartile Range (IQR) | 17.6% | 9.2% |
| Standard Deviation (Sample) | 14.7% | 8.8% |
| Standard Deviation (Population) | 14.4% | 8.7% |
Similar Demographics by In Labor Force | Age 16-19
Demographics Similar to Ute by In Labor Force | Age 16-19
In terms of in labor force | age 16-19, the demographic groups most similar to Ute are Immigrants from Brazil (37.1%, a difference of 0.050%), Yaqui (37.1%, a difference of 0.080%), Immigrants from Saudi Arabia (37.0%, a difference of 0.12%), Cambodian (37.0%, a difference of 0.27%), and Kiowa (37.2%, a difference of 0.34%).
| Demographics | Rating | Rank | In Labor Force | Age 16-19 |
| Immigrants | Poland | 84.4 /100 | #151 | Excellent 37.3% |
| Immigrants | Sierra Leone | 83.6 /100 | #152 | Excellent 37.3% |
| Arapaho | 81.8 /100 | #153 | Excellent 37.3% |
| Immigrants | Bulgaria | 81.6 /100 | #154 | Excellent 37.3% |
| Immigrants | Lithuania | 80.7 /100 | #155 | Excellent 37.2% |
| Kiowa | 80.4 /100 | #156 | Excellent 37.2% |
| Immigrants | Brazil | 76.5 /100 | #157 | Good 37.1% |
| Ute | 75.7 /100 | #158 | Good 37.1% |
| Yaqui | 74.4 /100 | #159 | Good 37.1% |
| Immigrants | Saudi Arabia | 73.9 /100 | #160 | Good 37.0% |
| Cambodians | 71.5 /100 | #161 | Good 37.0% |
| Immigrants | Jordan | 69.5 /100 | #162 | Good 36.9% |
| Bermudans | 69.3 /100 | #163 | Good 36.9% |
| Immigrants | Kuwait | 68.9 /100 | #164 | Good 36.9% |
| Yakama | 66.9 /100 | #165 | Good 36.9% |
Demographics Similar to Burmese by In Labor Force | Age 16-19
In terms of in labor force | age 16-19, the demographic groups most similar to Burmese are Hispanic or Latino (34.5%, a difference of 0.040%), Salvadoran (34.5%, a difference of 0.050%), Egyptian (34.5%, a difference of 0.090%), Immigrants (34.6%, a difference of 0.17%), and Immigrants from Egypt (34.6%, a difference of 0.19%).
| Demographics | Rating | Rank | In Labor Force | Age 16-19 |
| Immigrants | South Central Asia | 1.3 /100 | #256 | Tragic 34.6% |
| Immigrants | Egypt | 1.2 /100 | #257 | Tragic 34.6% |
| Thais | 1.2 /100 | #258 | Tragic 34.6% |
| Immigrants | Immigrants | 1.2 /100 | #259 | Tragic 34.6% |
| Egyptians | 1.2 /100 | #260 | Tragic 34.5% |
| Salvadorans | 1.1 /100 | #261 | Tragic 34.5% |
| Hispanics or Latinos | 1.1 /100 | #262 | Tragic 34.5% |
| Burmese | 1.1 /100 | #263 | Tragic 34.5% |
| Immigrants | Uruguay | 0.9 /100 | #264 | Tragic 34.4% |
| Immigrants | El Salvador | 0.7 /100 | #265 | Tragic 34.3% |
| Immigrants | Malaysia | 0.7 /100 | #266 | Tragic 34.3% |
| Immigrants | Peru | 0.5 /100 | #267 | Tragic 34.2% |
| Immigrants | Asia | 0.5 /100 | #268 | Tragic 34.1% |
| Pima | 0.5 /100 | #269 | Tragic 34.1% |
| Immigrants | Russia | 0.4 /100 | #270 | Tragic 34.1% |