Ute vs Colville Unemployment Among Ages 45 to 54 years
COMPARE
Ute
Colville
Unemployment Among Ages 45 to 54 years
Unemployment Among Ages 45 to 54 years Comparison
Ute
Colville
6.2%
UNEMPLOYMENT AMONG AGES 45 TO 54 YEARS
0.0/ 100
METRIC RATING
326th/ 347
METRIC RANK
7.4%
UNEMPLOYMENT AMONG AGES 45 TO 54 YEARS
0.0/ 100
METRIC RATING
338th/ 347
METRIC RANK
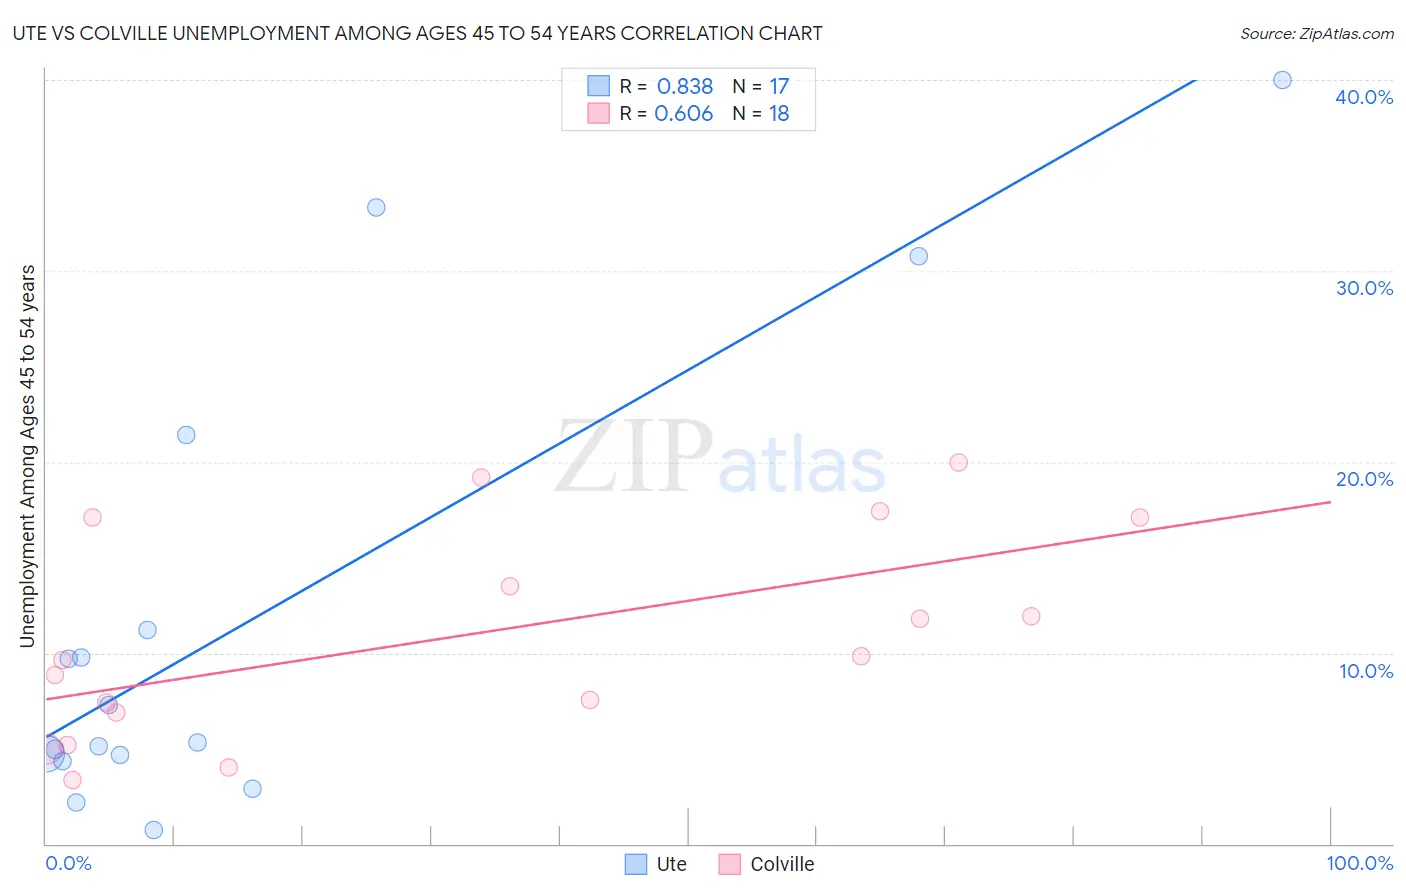
Ute vs Colville Unemployment Among Ages 45 to 54 years Correlation Chart
The statistical analysis conducted on geographies consisting of 55,276,716 people shows a very strong positive correlation between the proportion of Ute and unemployment rate among population between the ages 45 and 54 in the United States with a correlation coefficient (R) of 0.838 and weighted average of 6.2%. Similarly, the statistical analysis conducted on geographies consisting of 34,483,294 people shows a significant positive correlation between the proportion of Colville and unemployment rate among population between the ages 45 and 54 in the United States with a correlation coefficient (R) of 0.606 and weighted average of 7.4%, a difference of 19.2%.
Unemployment Among Ages 45 to 54 years Correlation Summary
| Measurement | Ute | Colville |
| Minimum | 0.70% | 3.3% |
| Maximum | 40.0% | 20.0% |
| Range | 39.3% | 16.7% |
| Mean | 11.7% | 10.9% |
| Median | 5.3% | 9.7% |
| Interquartile 25% (IQ1) | 4.5% | 6.9% |
| Interquartile 75% (IQ3) | 16.3% | 17.1% |
| Interquartile Range (IQR) | 11.8% | 10.2% |
| Standard Deviation (Sample) | 12.1% | 5.4% |
| Standard Deviation (Population) | 11.7% | 5.3% |
Demographics Similar to Ute and Colville by Unemployment Among Ages 45 to 54 years
In terms of unemployment among ages 45 to 54 years, the demographic groups most similar to Ute are Dominican (6.2%, a difference of 0.21%), Pueblo (6.2%, a difference of 0.42%), Immigrants from Armenia (6.1%, a difference of 0.84%), Alaska Native (6.3%, a difference of 1.1%), and Immigrants from Dominican Republic (6.3%, a difference of 1.3%). Similarly, the demographic groups most similar to Colville are Arapaho (7.5%, a difference of 1.5%), Hopi (7.5%, a difference of 1.9%), Apache (7.0%, a difference of 5.0%), Paiute (7.8%, a difference of 5.5%), and Puerto Rican (6.8%, a difference of 8.5%).
| Demographics | Rating | Rank | Unemployment Among Ages 45 to 54 years |
| Immigrants | Azores | 0.0 /100 | #322 | Tragic 5.7% |
| Immigrants | Cabo Verde | 0.0 /100 | #323 | Tragic 5.9% |
| Natives/Alaskans | 0.0 /100 | #324 | Tragic 6.1% |
| Immigrants | Armenia | 0.0 /100 | #325 | Tragic 6.1% |
| Ute | 0.0 /100 | #326 | Tragic 6.2% |
| Dominicans | 0.0 /100 | #327 | Tragic 6.2% |
| Pueblo | 0.0 /100 | #328 | Tragic 6.2% |
| Alaska Natives | 0.0 /100 | #329 | Tragic 6.3% |
| Immigrants | Dominican Republic | 0.0 /100 | #330 | Tragic 6.3% |
| Tohono O'odham | 0.0 /100 | #331 | Tragic 6.3% |
| Pima | 0.0 /100 | #332 | Tragic 6.4% |
| Immigrants | Yemen | 0.0 /100 | #333 | Tragic 6.5% |
| Sioux | 0.0 /100 | #334 | Tragic 6.6% |
| Navajo | 0.0 /100 | #335 | Tragic 6.7% |
| Puerto Ricans | 0.0 /100 | #336 | Tragic 6.8% |
| Apache | 0.0 /100 | #337 | Tragic 7.0% |
| Colville | 0.0 /100 | #338 | Tragic 7.4% |
| Arapaho | 0.0 /100 | #339 | Tragic 7.5% |
| Hopi | 0.0 /100 | #340 | Tragic 7.5% |
| Paiute | 0.0 /100 | #341 | Tragic 7.8% |
| Alaskan Athabascans | 0.0 /100 | #342 | Tragic 8.5% |