Ute vs Shoshone In Labor Force | Age 20-24
COMPARE
Ute
Shoshone
In Labor Force | Age 20-24
In Labor Force | Age 20-24 Comparison
Ute
Shoshone
73.8%
IN LABOR FORCE | AGE 20-24
1.0/ 100
METRIC RATING
254th/ 347
METRIC RANK
76.1%
IN LABOR FORCE | AGE 20-24
97.8/ 100
METRIC RATING
100th/ 347
METRIC RANK
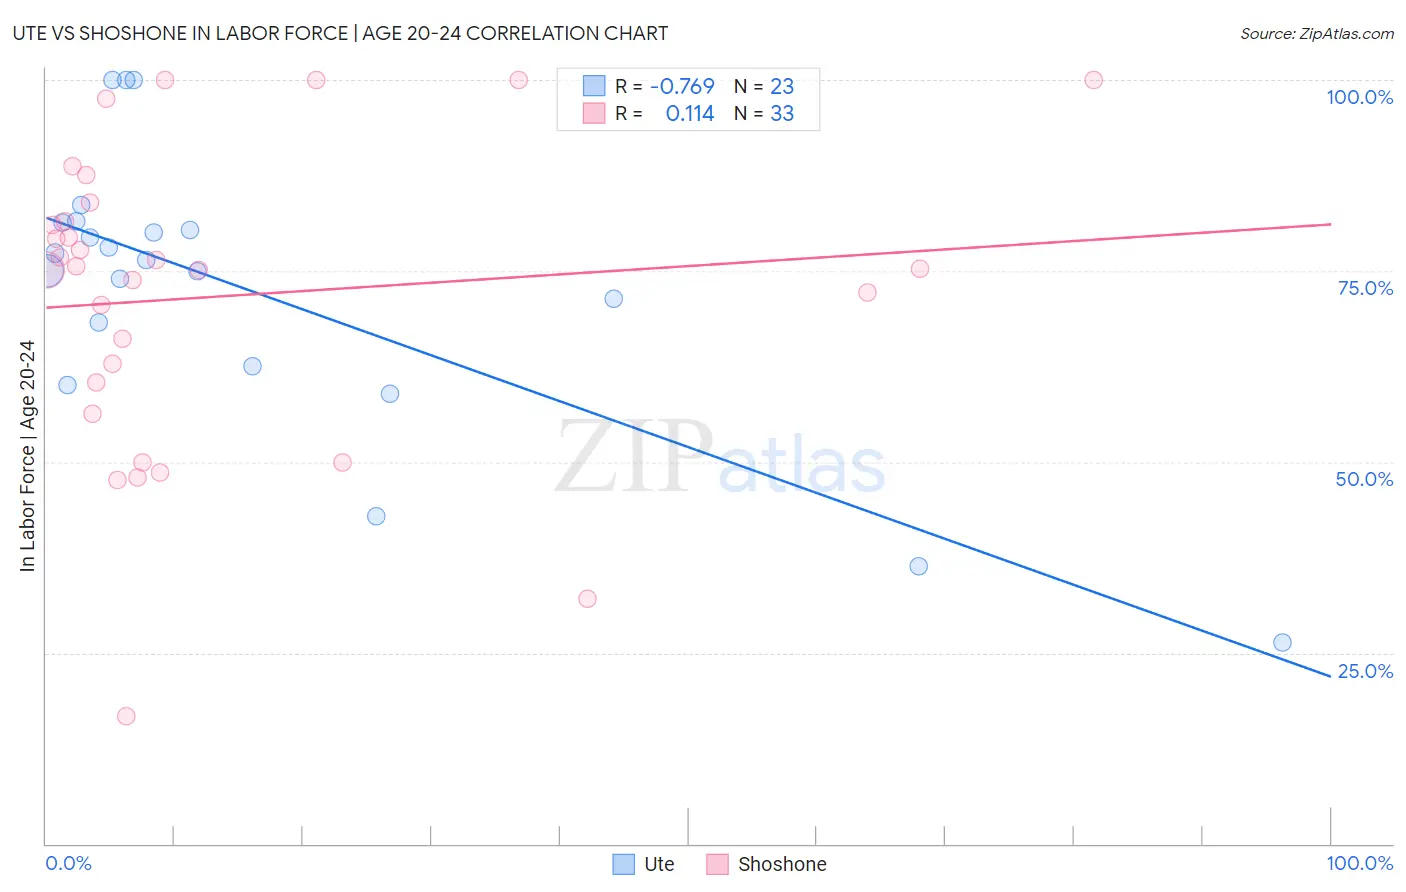
Ute vs Shoshone In Labor Force | Age 20-24 Correlation Chart
The statistical analysis conducted on geographies consisting of 55,663,255 people shows a strong negative correlation between the proportion of Ute and labor force participation rate among population between the ages 20 and 24 in the United States with a correlation coefficient (R) of -0.769 and weighted average of 73.8%. Similarly, the statistical analysis conducted on geographies consisting of 66,581,429 people shows a poor positive correlation between the proportion of Shoshone and labor force participation rate among population between the ages 20 and 24 in the United States with a correlation coefficient (R) of 0.114 and weighted average of 76.1%, a difference of 3.1%.
In Labor Force | Age 20-24 Correlation Summary
| Measurement | Ute | Shoshone |
| Minimum | 26.3% | 16.7% |
| Maximum | 100.0% | 100.0% |
| Range | 73.7% | 83.3% |
| Mean | 72.5% | 71.7% |
| Median | 76.4% | 75.4% |
| Interquartile 25% (IQ1) | 62.5% | 58.4% |
| Interquartile 75% (IQ3) | 81.3% | 82.8% |
| Interquartile Range (IQR) | 18.8% | 24.4% |
| Standard Deviation (Sample) | 18.6% | 19.9% |
| Standard Deviation (Population) | 18.1% | 19.6% |
Similar Demographics by In Labor Force | Age 20-24
Demographics Similar to Ute by In Labor Force | Age 20-24
In terms of in labor force | age 20-24, the demographic groups most similar to Ute are Arapaho (73.8%, a difference of 0.0%), Immigrants from Pakistan (73.8%, a difference of 0.020%), Immigrants from Kazakhstan (73.8%, a difference of 0.050%), Immigrants from Egypt (73.8%, a difference of 0.070%), and Spanish American Indian (73.7%, a difference of 0.070%).
| Demographics | Rating | Rank | In Labor Force | Age 20-24 |
| Colville | 1.5 /100 | #247 | Tragic 73.9% |
| Immigrants | Saudi Arabia | 1.5 /100 | #248 | Tragic 73.9% |
| Blacks/African Americans | 1.3 /100 | #249 | Tragic 73.9% |
| Immigrants | Belgium | 1.3 /100 | #250 | Tragic 73.9% |
| Immigrants | Egypt | 1.2 /100 | #251 | Tragic 73.8% |
| Immigrants | Kazakhstan | 1.1 /100 | #252 | Tragic 73.8% |
| Arapaho | 1.0 /100 | #253 | Tragic 73.8% |
| Ute | 1.0 /100 | #254 | Tragic 73.8% |
| Immigrants | Pakistan | 0.9 /100 | #255 | Tragic 73.8% |
| Spanish American Indians | 0.8 /100 | #256 | Tragic 73.7% |
| Paraguayans | 0.8 /100 | #257 | Tragic 73.7% |
| Egyptians | 0.7 /100 | #258 | Tragic 73.7% |
| Dutch West Indians | 0.7 /100 | #259 | Tragic 73.7% |
| Immigrants | Turkey | 0.7 /100 | #260 | Tragic 73.7% |
| Houma | 0.6 /100 | #261 | Tragic 73.7% |
Demographics Similar to Shoshone by In Labor Force | Age 20-24
In terms of in labor force | age 20-24, the demographic groups most similar to Shoshone are American (76.1%, a difference of 0.0%), Immigrants from Poland (76.1%, a difference of 0.020%), Latvian (76.1%, a difference of 0.020%), Immigrants from Lithuania (76.1%, a difference of 0.040%), and Immigrants from Oceania (76.1%, a difference of 0.040%).
| Demographics | Rating | Rank | In Labor Force | Age 20-24 |
| Hungarians | 98.9 /100 | #93 | Exceptional 76.3% |
| Potawatomi | 98.5 /100 | #94 | Exceptional 76.2% |
| Immigrants | Germany | 98.5 /100 | #95 | Exceptional 76.2% |
| Immigrants | Nonimmigrants | 98.5 /100 | #96 | Exceptional 76.2% |
| Immigrants | Lithuania | 98.0 /100 | #97 | Exceptional 76.1% |
| Immigrants | Oceania | 98.0 /100 | #98 | Exceptional 76.1% |
| Americans | 97.8 /100 | #99 | Exceptional 76.1% |
| Shoshone | 97.8 /100 | #100 | Exceptional 76.1% |
| Immigrants | Poland | 97.7 /100 | #101 | Exceptional 76.1% |
| Latvians | 97.6 /100 | #102 | Exceptional 76.1% |
| Immigrants | North Macedonia | 97.5 /100 | #103 | Exceptional 76.1% |
| Macedonians | 97.2 /100 | #104 | Exceptional 76.0% |
| Immigrants | Nepal | 97.2 /100 | #105 | Exceptional 76.0% |
| Immigrants | Uganda | 97.1 /100 | #106 | Exceptional 76.0% |
| Greeks | 96.9 /100 | #107 | Exceptional 76.0% |