Immigrants from Nicaragua vs Sri Lankan In Labor Force | Age 30-34
COMPARE
Immigrants from Nicaragua
Sri Lankan
In Labor Force | Age 30-34
In Labor Force | Age 30-34 Comparison
Immigrants from Nicaragua
Sri Lankans
83.9%
IN LABOR FORCE | AGE 30-34
0.6/ 100
METRIC RATING
253rd/ 347
METRIC RANK
85.0%
IN LABOR FORCE | AGE 30-34
87.8/ 100
METRIC RATING
138th/ 347
METRIC RANK
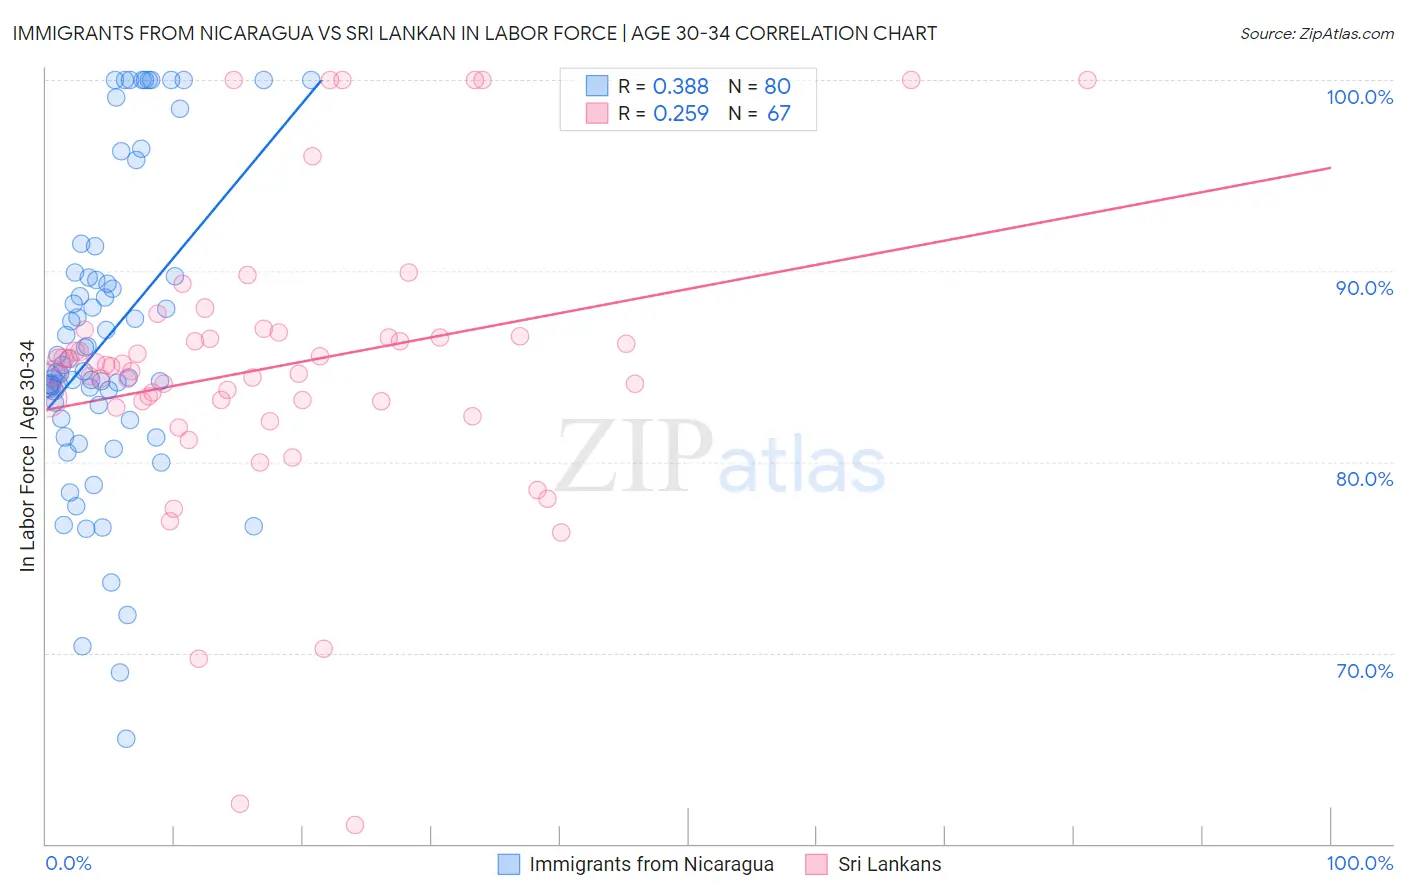
Immigrants from Nicaragua vs Sri Lankan In Labor Force | Age 30-34 Correlation Chart
The statistical analysis conducted on geographies consisting of 236,321,659 people shows a mild positive correlation between the proportion of Immigrants from Nicaragua and labor force participation rate among population between the ages 30 and 34 in the United States with a correlation coefficient (R) of 0.388 and weighted average of 83.9%. Similarly, the statistical analysis conducted on geographies consisting of 440,177,214 people shows a weak positive correlation between the proportion of Sri Lankans and labor force participation rate among population between the ages 30 and 34 in the United States with a correlation coefficient (R) of 0.259 and weighted average of 85.0%, a difference of 1.3%.
In Labor Force | Age 30-34 Correlation Summary
| Measurement | Immigrants from Nicaragua | Sri Lankan |
| Minimum | 65.5% | 61.0% |
| Maximum | 100.0% | 100.0% |
| Range | 34.5% | 39.0% |
| Mean | 86.5% | 85.0% |
| Median | 84.7% | 85.0% |
| Interquartile 25% (IQ1) | 82.6% | 83.2% |
| Interquartile 75% (IQ3) | 89.7% | 86.6% |
| Interquartile Range (IQR) | 7.1% | 3.4% |
| Standard Deviation (Sample) | 8.0% | 7.6% |
| Standard Deviation (Population) | 7.9% | 7.5% |
Similar Demographics by In Labor Force | Age 30-34
Demographics Similar to Immigrants from Nicaragua by In Labor Force | Age 30-34
In terms of in labor force | age 30-34, the demographic groups most similar to Immigrants from Nicaragua are Bahamian (83.9%, a difference of 0.0%), Nicaraguan (83.9%, a difference of 0.010%), Immigrants from Iraq (83.9%, a difference of 0.020%), Immigrants from St. Vincent and the Grenadines (83.9%, a difference of 0.020%), and Immigrants from Dominica (84.0%, a difference of 0.040%).
| Demographics | Rating | Rank | In Labor Force | Age 30-34 |
| Central Americans | 0.9 /100 | #246 | Tragic 84.0% |
| British West Indians | 0.8 /100 | #247 | Tragic 84.0% |
| Portuguese | 0.8 /100 | #248 | Tragic 84.0% |
| Immigrants | Dominica | 0.7 /100 | #249 | Tragic 84.0% |
| Immigrants | Iraq | 0.7 /100 | #250 | Tragic 83.9% |
| Nicaraguans | 0.6 /100 | #251 | Tragic 83.9% |
| Bahamians | 0.6 /100 | #252 | Tragic 83.9% |
| Immigrants | Nicaragua | 0.6 /100 | #253 | Tragic 83.9% |
| Immigrants | St. Vincent and the Grenadines | 0.5 /100 | #254 | Tragic 83.9% |
| Whites/Caucasians | 0.5 /100 | #255 | Tragic 83.9% |
| Immigrants | Lebanon | 0.4 /100 | #256 | Tragic 83.9% |
| Iraqis | 0.3 /100 | #257 | Tragic 83.8% |
| Hondurans | 0.3 /100 | #258 | Tragic 83.8% |
| Scotch-Irish | 0.3 /100 | #259 | Tragic 83.8% |
| Immigrants | Dominican Republic | 0.3 /100 | #260 | Tragic 83.8% |
Demographics Similar to Sri Lankans by In Labor Force | Age 30-34
In terms of in labor force | age 30-34, the demographic groups most similar to Sri Lankans are South African (85.0%, a difference of 0.0%), Jordanian (85.0%, a difference of 0.010%), Bhutanese (85.0%, a difference of 0.010%), Immigrants from Chile (85.0%, a difference of 0.020%), and Immigrants from Asia (85.0%, a difference of 0.020%).
| Demographics | Rating | Rank | In Labor Force | Age 30-34 |
| Chinese | 89.6 /100 | #131 | Excellent 85.0% |
| Immigrants | Israel | 89.5 /100 | #132 | Excellent 85.0% |
| New Zealanders | 89.5 /100 | #133 | Excellent 85.0% |
| Immigrants | Chile | 89.2 /100 | #134 | Excellent 85.0% |
| Immigrants | Asia | 88.9 /100 | #135 | Excellent 85.0% |
| Jordanians | 88.6 /100 | #136 | Excellent 85.0% |
| South Africans | 88.0 /100 | #137 | Excellent 85.0% |
| Sri Lankans | 87.8 /100 | #138 | Excellent 85.0% |
| Bhutanese | 87.5 /100 | #139 | Excellent 85.0% |
| Immigrants | Vietnam | 86.5 /100 | #140 | Excellent 85.0% |
| Chileans | 85.3 /100 | #141 | Excellent 84.9% |
| Immigrants | Indonesia | 84.3 /100 | #142 | Excellent 84.9% |
| Colombians | 82.2 /100 | #143 | Excellent 84.9% |
| Uruguayans | 78.5 /100 | #144 | Good 84.9% |
| Palestinians | 77.7 /100 | #145 | Good 84.9% |