Spanish American vs South American Indian In Labor Force | Age 45-54
COMPARE
Spanish American
South American Indian
In Labor Force | Age 45-54
In Labor Force | Age 45-54 Comparison
Spanish Americans
South American Indians
80.1%
IN LABOR FORCE | AGE 45-54
0.0/ 100
METRIC RATING
306th/ 347
METRIC RANK
82.9%
IN LABOR FORCE | AGE 45-54
62.2/ 100
METRIC RATING
161st/ 347
METRIC RANK
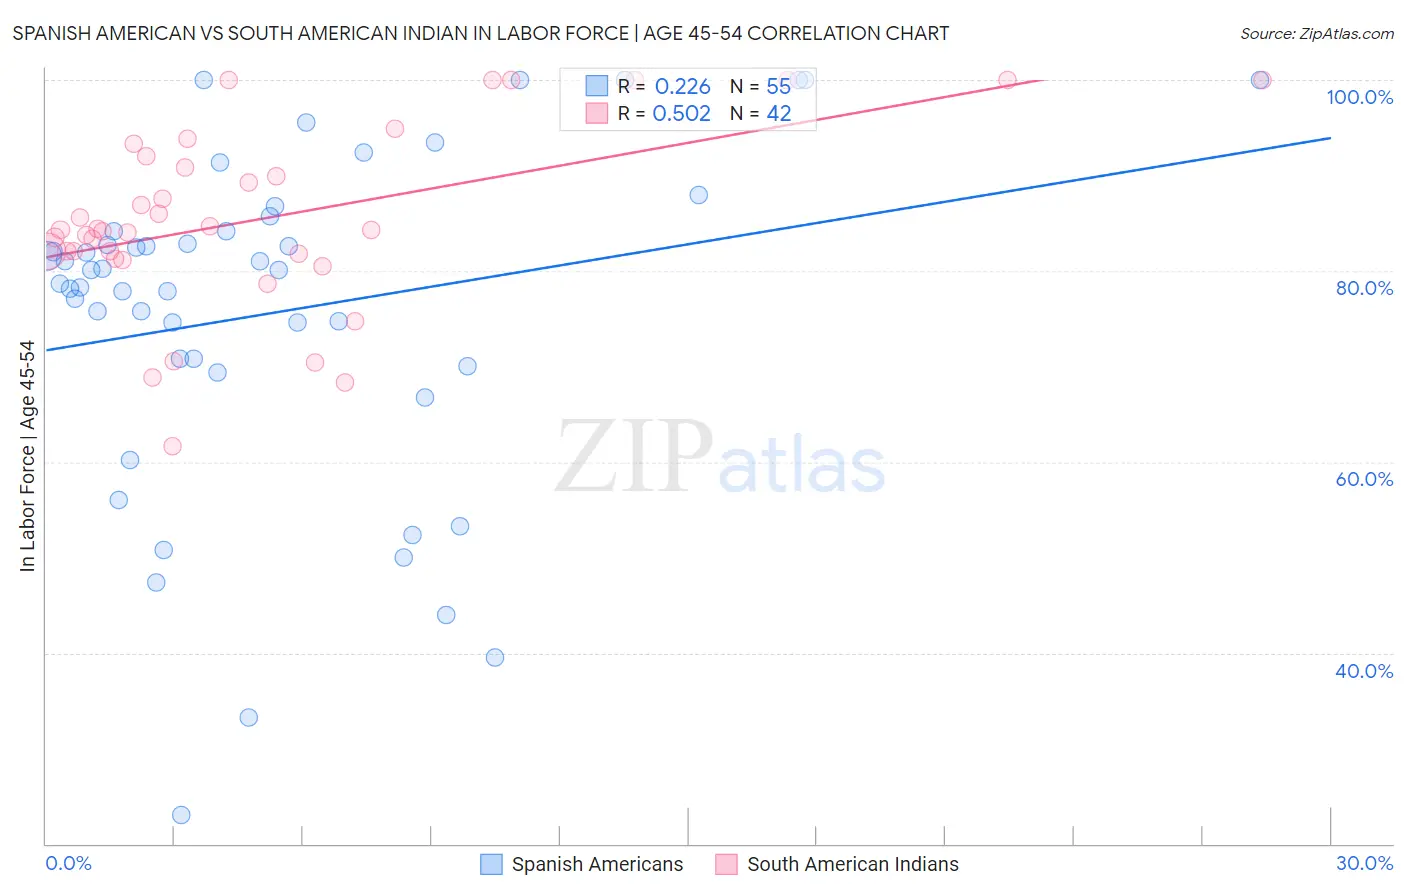
Spanish American vs South American Indian In Labor Force | Age 45-54 Correlation Chart
The statistical analysis conducted on geographies consisting of 103,159,967 people shows a weak positive correlation between the proportion of Spanish Americans and labor force participation rate among population between the ages 45 and 54 in the United States with a correlation coefficient (R) of 0.226 and weighted average of 80.1%. Similarly, the statistical analysis conducted on geographies consisting of 164,535,706 people shows a substantial positive correlation between the proportion of South American Indians and labor force participation rate among population between the ages 45 and 54 in the United States with a correlation coefficient (R) of 0.502 and weighted average of 82.9%, a difference of 3.5%.
In Labor Force | Age 45-54 Correlation Summary
| Measurement | Spanish American | South American Indian |
| Minimum | 23.0% | 61.7% |
| Maximum | 100.0% | 100.0% |
| Range | 77.0% | 38.3% |
| Mean | 75.7% | 85.5% |
| Median | 80.1% | 84.3% |
| Interquartile 25% (IQ1) | 70.0% | 81.7% |
| Interquartile 75% (IQ3) | 84.1% | 91.9% |
| Interquartile Range (IQR) | 14.1% | 10.2% |
| Standard Deviation (Sample) | 17.6% | 9.5% |
| Standard Deviation (Population) | 17.4% | 9.4% |
Similar Demographics by In Labor Force | Age 45-54
Demographics Similar to Spanish Americans by In Labor Force | Age 45-54
In terms of in labor force | age 45-54, the demographic groups most similar to Spanish Americans are Immigrants from Dominican Republic (80.1%, a difference of 0.040%), Hispanic or Latino (80.1%, a difference of 0.050%), Immigrants from the Azores (80.1%, a difference of 0.070%), Blackfeet (80.0%, a difference of 0.080%), and Central American Indian (80.0%, a difference of 0.12%).
| Demographics | Rating | Rank | In Labor Force | Age 45-54 |
| Dominicans | 0.0 /100 | #299 | Tragic 80.3% |
| Fijians | 0.0 /100 | #300 | Tragic 80.2% |
| Spanish American Indians | 0.0 /100 | #301 | Tragic 80.2% |
| Immigrants | Central America | 0.0 /100 | #302 | Tragic 80.2% |
| Immigrants | Azores | 0.0 /100 | #303 | Tragic 80.1% |
| Hispanics or Latinos | 0.0 /100 | #304 | Tragic 80.1% |
| Immigrants | Dominican Republic | 0.0 /100 | #305 | Tragic 80.1% |
| Spanish Americans | 0.0 /100 | #306 | Tragic 80.1% |
| Blackfeet | 0.0 /100 | #307 | Tragic 80.0% |
| Central American Indians | 0.0 /100 | #308 | Tragic 80.0% |
| Potawatomi | 0.0 /100 | #309 | Tragic 80.0% |
| Inupiat | 0.0 /100 | #310 | Tragic 79.9% |
| Mexicans | 0.0 /100 | #311 | Tragic 79.8% |
| Immigrants | Mexico | 0.0 /100 | #312 | Tragic 79.7% |
| Colville | 0.0 /100 | #313 | Tragic 79.5% |
Demographics Similar to South American Indians by In Labor Force | Age 45-54
In terms of in labor force | age 45-54, the demographic groups most similar to South American Indians are Haitian (82.8%, a difference of 0.0%), Dutch (82.8%, a difference of 0.0%), Laotian (82.9%, a difference of 0.010%), German Russian (82.8%, a difference of 0.010%), and Immigrants from Austria (82.9%, a difference of 0.020%).
| Demographics | Rating | Rank | In Labor Force | Age 45-54 |
| Immigrants | Ghana | 70.3 /100 | #154 | Good 82.9% |
| Immigrants | Philippines | 69.0 /100 | #155 | Good 82.9% |
| Immigrants | Saudi Arabia | 68.8 /100 | #156 | Good 82.9% |
| Immigrants | Australia | 68.2 /100 | #157 | Good 82.9% |
| Immigrants | Southern Europe | 67.8 /100 | #158 | Good 82.9% |
| Immigrants | Austria | 64.6 /100 | #159 | Good 82.9% |
| Laotians | 62.8 /100 | #160 | Good 82.9% |
| South American Indians | 62.2 /100 | #161 | Good 82.9% |
| Haitians | 61.8 /100 | #162 | Good 82.8% |
| Dutch | 61.7 /100 | #163 | Good 82.8% |
| German Russians | 61.3 /100 | #164 | Good 82.8% |
| Immigrants | Sudan | 59.9 /100 | #165 | Average 82.8% |
| Immigrants | South Eastern Asia | 57.4 /100 | #166 | Average 82.8% |
| Swiss | 56.5 /100 | #167 | Average 82.8% |
| Immigrants | South Africa | 55.8 /100 | #168 | Average 82.8% |