U.S. Virgin Islander vs Scandinavian Ambulatory Disability
COMPARE
U.S. Virgin Islander
Scandinavian
Ambulatory Disability
Ambulatory Disability Comparison
U.S. Virgin Islanders
Scandinavians
6.8%
AMBULATORY DISABILITY
0.0/ 100
METRIC RATING
287th/ 347
METRIC RANK
6.1%
AMBULATORY DISABILITY
44.5/ 100
METRIC RATING
178th/ 347
METRIC RANK
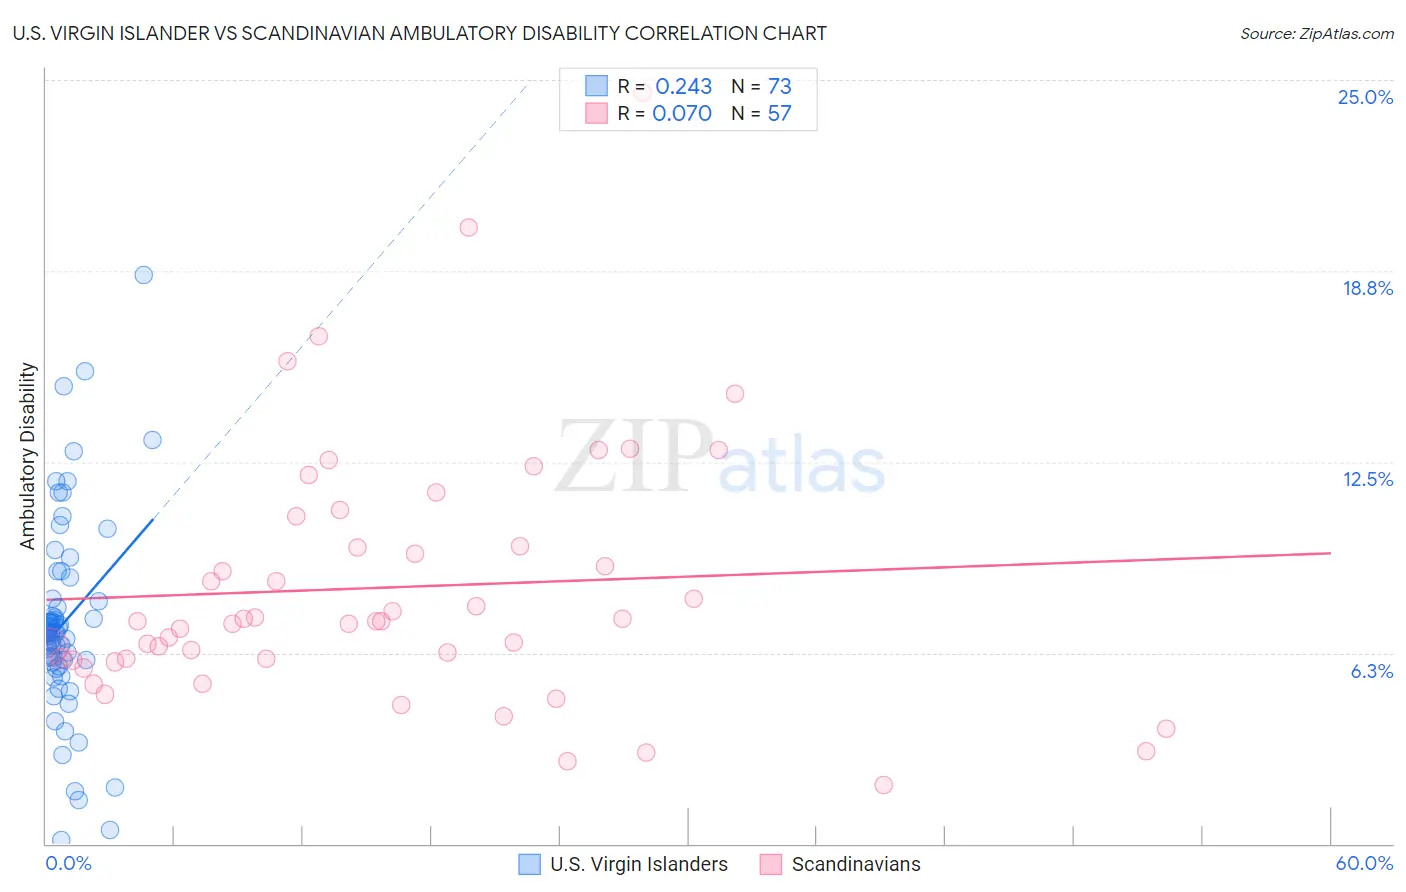
U.S. Virgin Islander vs Scandinavian Ambulatory Disability Correlation Chart
The statistical analysis conducted on geographies consisting of 87,521,304 people shows a weak positive correlation between the proportion of U.S. Virgin Islanders and percentage of population with ambulatory disability in the United States with a correlation coefficient (R) of 0.243 and weighted average of 6.8%. Similarly, the statistical analysis conducted on geographies consisting of 472,401,593 people shows a slight positive correlation between the proportion of Scandinavians and percentage of population with ambulatory disability in the United States with a correlation coefficient (R) of 0.070 and weighted average of 6.1%, a difference of 11.4%.
Ambulatory Disability Correlation Summary
| Measurement | U.S. Virgin Islander | Scandinavian |
| Minimum | 0.13% | 1.9% |
| Maximum | 18.6% | 24.6% |
| Range | 18.5% | 22.7% |
| Mean | 7.2% | 8.4% |
| Median | 6.9% | 7.3% |
| Interquartile 25% (IQ1) | 6.0% | 6.0% |
| Interquartile 75% (IQ3) | 8.0% | 10.2% |
| Interquartile Range (IQR) | 2.0% | 4.2% |
| Standard Deviation (Sample) | 3.2% | 4.2% |
| Standard Deviation (Population) | 3.2% | 4.2% |
Similar Demographics by Ambulatory Disability
Demographics Similar to U.S. Virgin Islanders by Ambulatory Disability
In terms of ambulatory disability, the demographic groups most similar to U.S. Virgin Islanders are Nonimmigrants (6.9%, a difference of 0.27%), Yakama (6.8%, a difference of 0.32%), Fijian (6.8%, a difference of 0.36%), Immigrants from Dominica (6.9%, a difference of 0.41%), and Scotch-Irish (6.9%, a difference of 0.44%).
| Demographics | Rating | Rank | Ambulatory Disability |
| Pennsylvania Germans | 0.0 /100 | #280 | Tragic 6.8% |
| Yaqui | 0.0 /100 | #281 | Tragic 6.8% |
| Barbadians | 0.0 /100 | #282 | Tragic 6.8% |
| Immigrants | Barbados | 0.0 /100 | #283 | Tragic 6.8% |
| Immigrants | Jamaica | 0.0 /100 | #284 | Tragic 6.8% |
| Fijians | 0.0 /100 | #285 | Tragic 6.8% |
| Yakama | 0.0 /100 | #286 | Tragic 6.8% |
| U.S. Virgin Islanders | 0.0 /100 | #287 | Tragic 6.8% |
| Immigrants | Nonimmigrants | 0.0 /100 | #288 | Tragic 6.9% |
| Immigrants | Dominica | 0.0 /100 | #289 | Tragic 6.9% |
| Scotch-Irish | 0.0 /100 | #290 | Tragic 6.9% |
| West Indians | 0.0 /100 | #291 | Tragic 6.9% |
| Cheyenne | 0.0 /100 | #292 | Tragic 6.9% |
| Immigrants | St. Vincent and the Grenadines | 0.0 /100 | #293 | Tragic 6.9% |
| Cape Verdeans | 0.0 /100 | #294 | Tragic 6.9% |
Demographics Similar to Scandinavians by Ambulatory Disability
In terms of ambulatory disability, the demographic groups most similar to Scandinavians are Austrian (6.1%, a difference of 0.020%), Immigrants from Nicaragua (6.1%, a difference of 0.030%), Immigrants from England (6.1%, a difference of 0.050%), Immigrants from North America (6.1%, a difference of 0.060%), and Swiss (6.1%, a difference of 0.080%).
| Demographics | Rating | Rank | Ambulatory Disability |
| Moroccans | 52.6 /100 | #171 | Average 6.1% |
| Immigrants | Burma/Myanmar | 52.2 /100 | #172 | Average 6.1% |
| Croatians | 51.2 /100 | #173 | Average 6.1% |
| Immigrants | Canada | 50.0 /100 | #174 | Average 6.1% |
| Vietnamese | 47.2 /100 | #175 | Average 6.1% |
| Immigrants | North America | 45.6 /100 | #176 | Average 6.1% |
| Immigrants | England | 45.4 /100 | #177 | Average 6.1% |
| Scandinavians | 44.5 /100 | #178 | Average 6.1% |
| Austrians | 44.1 /100 | #179 | Average 6.1% |
| Immigrants | Nicaragua | 43.9 /100 | #180 | Average 6.1% |
| Swiss | 43.1 /100 | #181 | Average 6.1% |
| Serbians | 42.8 /100 | #182 | Average 6.1% |
| Immigrants | Thailand | 42.2 /100 | #183 | Average 6.1% |
| Immigrants | Ghana | 41.2 /100 | #184 | Average 6.1% |
| Immigrants | Bosnia and Herzegovina | 37.2 /100 | #185 | Fair 6.2% |