U.S. Virgin Islander vs Slovak In Labor Force | Age > 16
COMPARE
U.S. Virgin Islander
Slovak
In Labor Force | Age > 16
In Labor Force | Age > 16 Comparison
U.S. Virgin Islanders
Slovaks
64.7%
IN LABOR FORCE | AGE > 16
11.3/ 100
METRIC RATING
217th/ 347
METRIC RANK
63.9%
IN LABOR FORCE | AGE > 16
0.1/ 100
METRIC RATING
285th/ 347
METRIC RANK
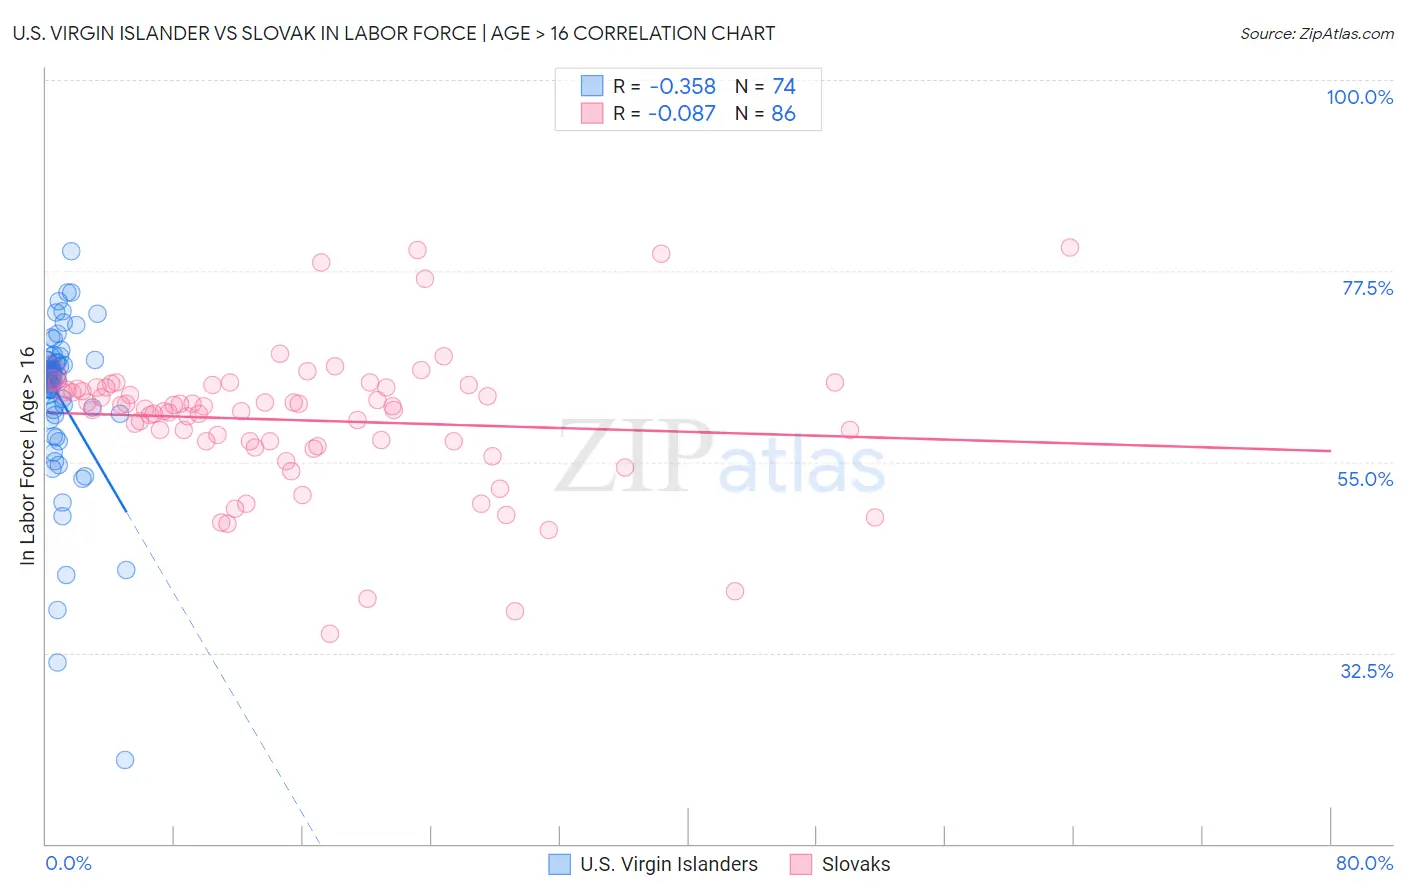
U.S. Virgin Islander vs Slovak In Labor Force | Age > 16 Correlation Chart
The statistical analysis conducted on geographies consisting of 87,527,161 people shows a mild negative correlation between the proportion of U.S. Virgin Islanders and labor force participation rate among population ages 16 and over in the United States with a correlation coefficient (R) of -0.358 and weighted average of 64.7%. Similarly, the statistical analysis conducted on geographies consisting of 397,893,626 people shows a slight negative correlation between the proportion of Slovaks and labor force participation rate among population ages 16 and over in the United States with a correlation coefficient (R) of -0.087 and weighted average of 63.9%, a difference of 1.3%.
In Labor Force | Age > 16 Correlation Summary
| Measurement | U.S. Virgin Islander | Slovak |
| Minimum | 19.9% | 34.7% |
| Maximum | 79.8% | 80.2% |
| Range | 59.9% | 45.5% |
| Mean | 62.4% | 59.9% |
| Median | 64.8% | 61.4% |
| Interquartile 25% (IQ1) | 60.6% | 57.4% |
| Interquartile 75% (IQ3) | 66.8% | 63.8% |
| Interquartile Range (IQR) | 6.2% | 6.4% |
| Standard Deviation (Sample) | 9.7% | 8.2% |
| Standard Deviation (Population) | 9.6% | 8.2% |
Similar Demographics by In Labor Force | Age > 16
Demographics Similar to U.S. Virgin Islanders by In Labor Force | Age > 16
In terms of in labor force | age > 16, the demographic groups most similar to U.S. Virgin Islanders are Belgian (64.7%, a difference of 0.0%), Alsatian (64.7%, a difference of 0.020%), Immigrants from Central America (64.7%, a difference of 0.020%), Immigrants from Czechoslovakia (64.8%, a difference of 0.030%), and Alaska Native (64.7%, a difference of 0.040%).
| Demographics | Rating | Rank | In Labor Force | Age > 16 |
| Immigrants | Denmark | 14.7 /100 | #210 | Poor 64.8% |
| Fijians | 14.1 /100 | #211 | Poor 64.8% |
| Alaskan Athabascans | 13.9 /100 | #212 | Poor 64.8% |
| Maltese | 13.8 /100 | #213 | Poor 64.8% |
| Estonians | 13.1 /100 | #214 | Poor 64.8% |
| Immigrants | Czechoslovakia | 12.3 /100 | #215 | Poor 64.8% |
| Belgians | 11.4 /100 | #216 | Poor 64.7% |
| U.S. Virgin Islanders | 11.3 /100 | #217 | Poor 64.7% |
| Alsatians | 10.7 /100 | #218 | Poor 64.7% |
| Immigrants | Central America | 10.5 /100 | #219 | Poor 64.7% |
| Alaska Natives | 9.9 /100 | #220 | Tragic 64.7% |
| Immigrants | Micronesia | 9.6 /100 | #221 | Tragic 64.7% |
| Hawaiians | 9.3 /100 | #222 | Tragic 64.7% |
| Immigrants | Belize | 9.2 /100 | #223 | Tragic 64.7% |
| Immigrants | Jamaica | 8.8 /100 | #224 | Tragic 64.7% |
Demographics Similar to Slovaks by In Labor Force | Age > 16
In terms of in labor force | age > 16, the demographic groups most similar to Slovaks are French (63.9%, a difference of 0.030%), Immigrants from Austria (63.9%, a difference of 0.030%), Scottish (63.9%, a difference of 0.030%), Immigrants from Germany (63.9%, a difference of 0.040%), and Spanish (63.9%, a difference of 0.070%).
| Demographics | Rating | Rank | In Labor Force | Age > 16 |
| Assyrians/Chaldeans/Syriacs | 0.3 /100 | #278 | Tragic 64.0% |
| Welsh | 0.2 /100 | #279 | Tragic 64.0% |
| Immigrants | St. Vincent and the Grenadines | 0.2 /100 | #280 | Tragic 64.0% |
| French Canadians | 0.2 /100 | #281 | Tragic 64.0% |
| Immigrants | Guyana | 0.2 /100 | #282 | Tragic 64.0% |
| Immigrants | Germany | 0.1 /100 | #283 | Tragic 63.9% |
| French | 0.1 /100 | #284 | Tragic 63.9% |
| Slovaks | 0.1 /100 | #285 | Tragic 63.9% |
| Immigrants | Austria | 0.1 /100 | #286 | Tragic 63.9% |
| Scottish | 0.1 /100 | #287 | Tragic 63.9% |
| Spanish | 0.1 /100 | #288 | Tragic 63.9% |
| Celtics | 0.1 /100 | #289 | Tragic 63.8% |
| Hungarians | 0.1 /100 | #290 | Tragic 63.8% |
| Nepalese | 0.1 /100 | #291 | Tragic 63.8% |
| Spanish American Indians | 0.1 /100 | #292 | Tragic 63.8% |