U.S. Virgin Islander vs Colombian In Labor Force | Age 20-24
COMPARE
U.S. Virgin Islander
Colombian
In Labor Force | Age 20-24
In Labor Force | Age 20-24 Comparison
U.S. Virgin Islanders
Colombians
73.0%
IN LABOR FORCE | AGE 20-24
0.1/ 100
METRIC RATING
289th/ 347
METRIC RANK
73.5%
IN LABOR FORCE | AGE 20-24
0.3/ 100
METRIC RATING
269th/ 347
METRIC RANK
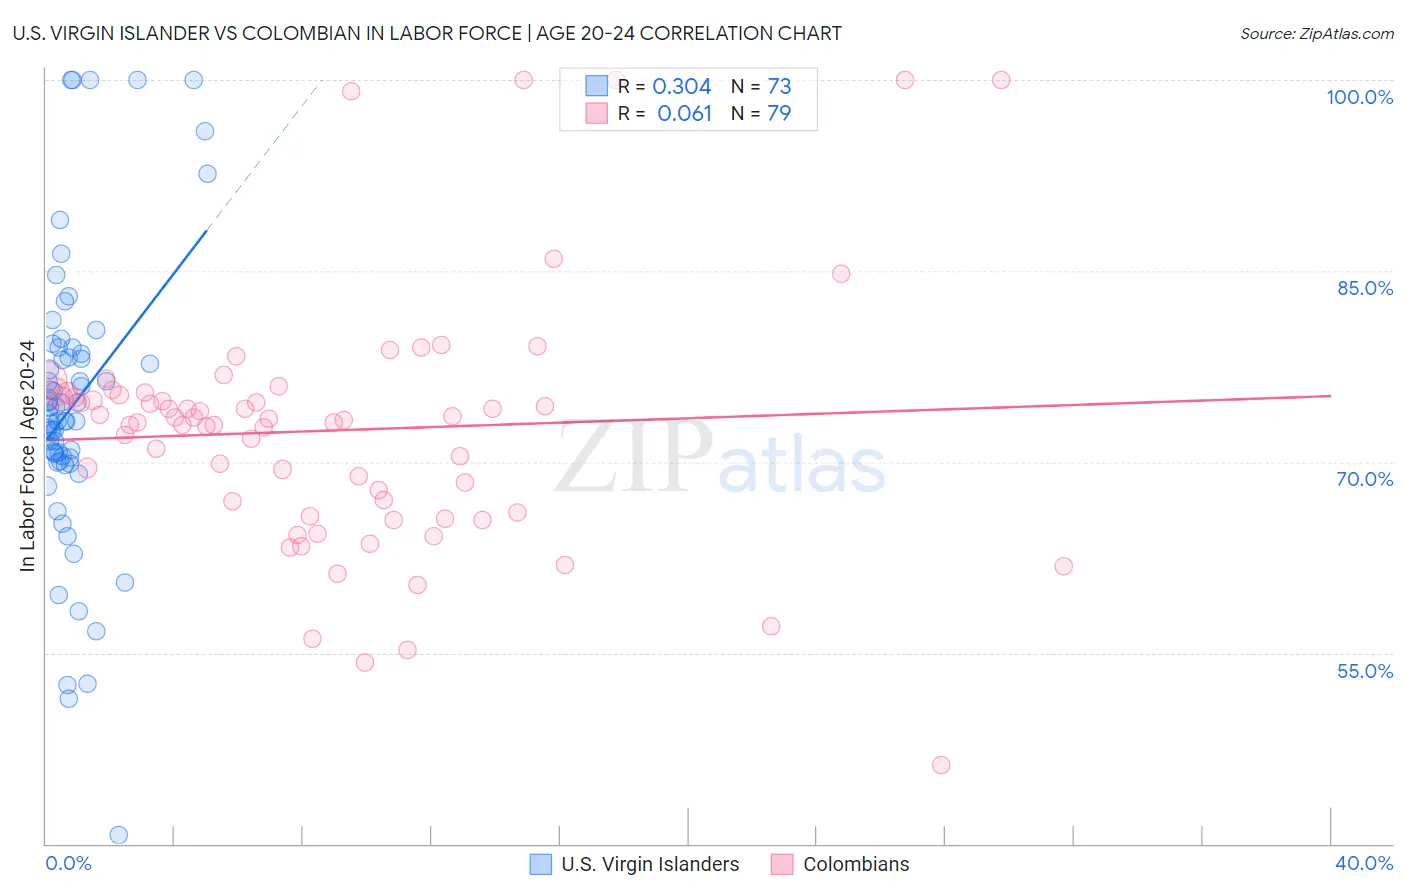
U.S. Virgin Islander vs Colombian In Labor Force | Age 20-24 Correlation Chart
The statistical analysis conducted on geographies consisting of 87,526,694 people shows a mild positive correlation between the proportion of U.S. Virgin Islanders and labor force participation rate among population between the ages 20 and 24 in the United States with a correlation coefficient (R) of 0.304 and weighted average of 73.0%. Similarly, the statistical analysis conducted on geographies consisting of 419,536,889 people shows a slight positive correlation between the proportion of Colombians and labor force participation rate among population between the ages 20 and 24 in the United States with a correlation coefficient (R) of 0.061 and weighted average of 73.5%, a difference of 0.61%.
In Labor Force | Age 20-24 Correlation Summary
| Measurement | U.S. Virgin Islander | Colombian |
| Minimum | 40.7% | 46.2% |
| Maximum | 100.0% | 100.0% |
| Range | 59.3% | 53.8% |
| Mean | 74.5% | 72.5% |
| Median | 73.8% | 73.3% |
| Interquartile 25% (IQ1) | 70.2% | 66.0% |
| Interquartile 75% (IQ3) | 78.7% | 75.4% |
| Interquartile Range (IQR) | 8.5% | 9.4% |
| Standard Deviation (Sample) | 11.3% | 9.9% |
| Standard Deviation (Population) | 11.2% | 9.8% |
Demographics Similar to U.S. Virgin Islanders and Colombians by In Labor Force | Age 20-24
In terms of in labor force | age 20-24, the demographic groups most similar to U.S. Virgin Islanders are Argentinean (73.1%, a difference of 0.030%), Immigrants from Korea (73.1%, a difference of 0.11%), Immigrants from Lebanon (73.1%, a difference of 0.13%), Nicaraguan (73.2%, a difference of 0.16%), and Kiowa (73.2%, a difference of 0.22%). Similarly, the demographic groups most similar to Colombians are Immigrants from Russia (73.5%, a difference of 0.030%), Immigrants from Indonesia (73.4%, a difference of 0.090%), Belizean (73.4%, a difference of 0.10%), Cheyenne (73.4%, a difference of 0.13%), and Immigrants from Colombia (73.4%, a difference of 0.14%).
| Demographics | Rating | Rank | In Labor Force | Age 20-24 |
| Colombians | 0.3 /100 | #269 | Tragic 73.5% |
| Immigrants | Russia | 0.3 /100 | #270 | Tragic 73.5% |
| Immigrants | Indonesia | 0.3 /100 | #271 | Tragic 73.4% |
| Belizeans | 0.3 /100 | #272 | Tragic 73.4% |
| Cheyenne | 0.2 /100 | #273 | Tragic 73.4% |
| Immigrants | Colombia | 0.2 /100 | #274 | Tragic 73.4% |
| Immigrants | South America | 0.2 /100 | #275 | Tragic 73.3% |
| Mongolians | 0.2 /100 | #276 | Tragic 73.3% |
| Immigrants | Malaysia | 0.2 /100 | #277 | Tragic 73.3% |
| Cypriots | 0.2 /100 | #278 | Tragic 73.3% |
| Venezuelans | 0.2 /100 | #279 | Tragic 73.3% |
| Bahamians | 0.1 /100 | #280 | Tragic 73.3% |
| Immigrants | Venezuela | 0.1 /100 | #281 | Tragic 73.2% |
| Immigrants | Spain | 0.1 /100 | #282 | Tragic 73.2% |
| Immigrants | Bahamas | 0.1 /100 | #283 | Tragic 73.2% |
| Kiowa | 0.1 /100 | #284 | Tragic 73.2% |
| Nicaraguans | 0.1 /100 | #285 | Tragic 73.2% |
| Immigrants | Lebanon | 0.1 /100 | #286 | Tragic 73.1% |
| Immigrants | Korea | 0.1 /100 | #287 | Tragic 73.1% |
| Argentineans | 0.1 /100 | #288 | Tragic 73.1% |
| U.S. Virgin Islanders | 0.1 /100 | #289 | Tragic 73.0% |