German vs Immigrants from Netherlands In Labor Force | Age 16-19
COMPARE
German
Immigrants from Netherlands
In Labor Force | Age 16-19
In Labor Force | Age 16-19 Comparison
Germans
Immigrants from Netherlands
44.2%
IN LABOR FORCE | AGE 16-19
100.0/ 100
METRIC RATING
10th/ 347
METRIC RANK
37.8%
IN LABOR FORCE | AGE 16-19
93.7/ 100
METRIC RATING
134th/ 347
METRIC RANK
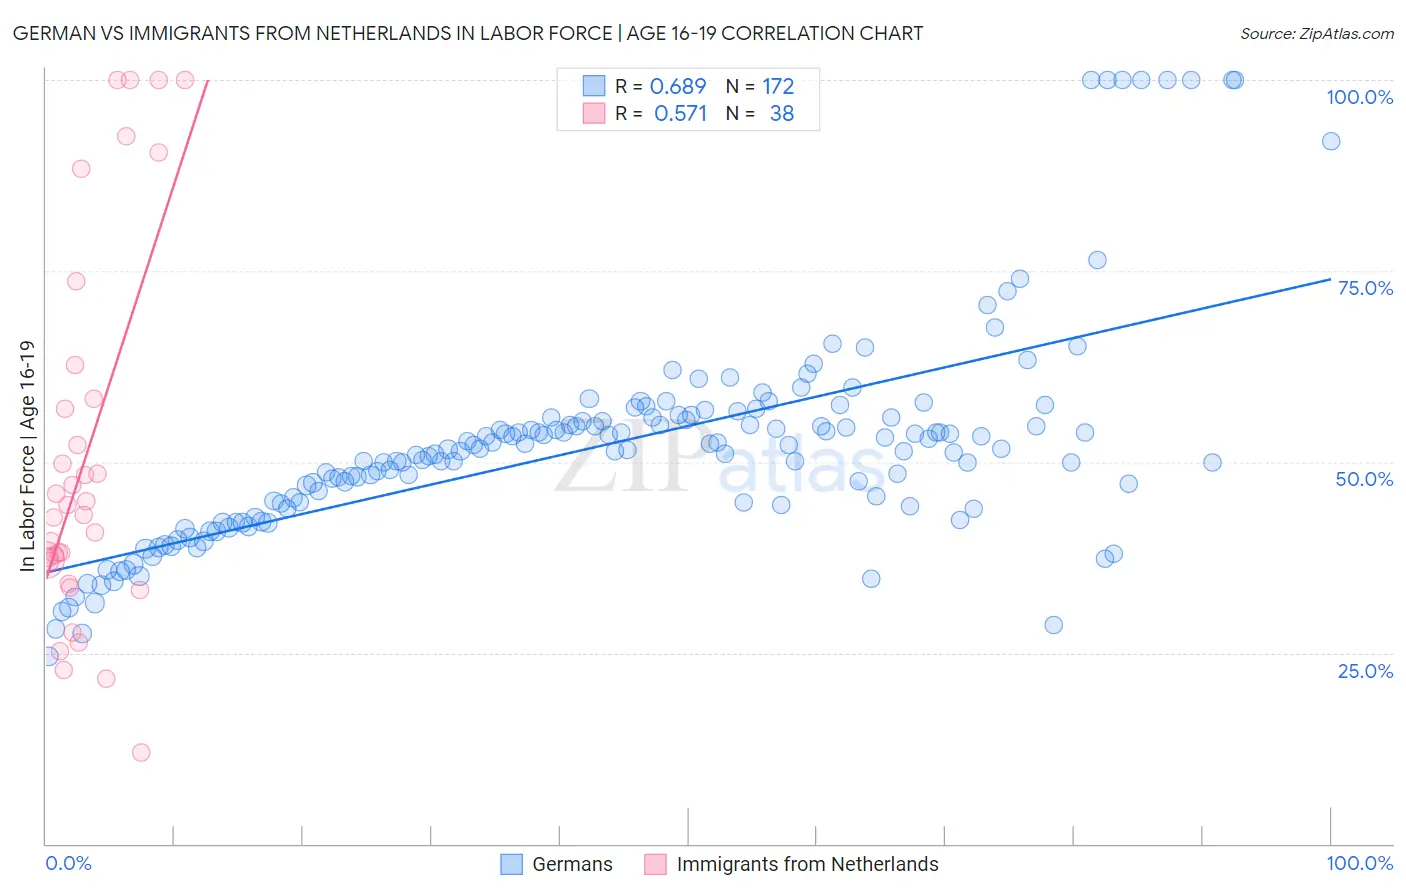
German vs Immigrants from Netherlands In Labor Force | Age 16-19 Correlation Chart
The statistical analysis conducted on geographies consisting of 575,301,683 people shows a significant positive correlation between the proportion of Germans and labor force participation rate among population between the ages 16 and 19 in the United States with a correlation coefficient (R) of 0.689 and weighted average of 44.2%. Similarly, the statistical analysis conducted on geographies consisting of 237,512,378 people shows a substantial positive correlation between the proportion of Immigrants from Netherlands and labor force participation rate among population between the ages 16 and 19 in the United States with a correlation coefficient (R) of 0.571 and weighted average of 37.8%, a difference of 16.8%.
In Labor Force | Age 16-19 Correlation Summary
| Measurement | German | Immigrants from Netherlands |
| Minimum | 24.6% | 12.0% |
| Maximum | 100.0% | 100.0% |
| Range | 75.4% | 88.0% |
| Mean | 52.2% | 50.8% |
| Median | 51.6% | 43.7% |
| Interquartile 25% (IQ1) | 44.2% | 36.9% |
| Interquartile 75% (IQ3) | 55.7% | 58.3% |
| Interquartile Range (IQR) | 11.4% | 21.4% |
| Standard Deviation (Sample) | 14.3% | 24.7% |
| Standard Deviation (Population) | 14.2% | 24.3% |
Similar Demographics by In Labor Force | Age 16-19
Demographics Similar to Germans by In Labor Force | Age 16-19
In terms of in labor force | age 16-19, the demographic groups most similar to Germans are Swedish (44.1%, a difference of 0.080%), Finnish (43.9%, a difference of 0.54%), Dutch (43.8%, a difference of 0.73%), Cape Verdean (44.5%, a difference of 0.74%), and Chippewa (43.8%, a difference of 0.83%).
| Demographics | Rating | Rank | In Labor Force | Age 16-19 |
| Immigrants | Somalia | 100.0 /100 | #3 | Exceptional 45.6% |
| Luxembourgers | 100.0 /100 | #4 | Exceptional 45.3% |
| Alaskan Athabascans | 100.0 /100 | #5 | Exceptional 45.2% |
| Somalis | 100.0 /100 | #6 | Exceptional 45.1% |
| Danes | 100.0 /100 | #7 | Exceptional 44.7% |
| Immigrants | Cabo Verde | 100.0 /100 | #8 | Exceptional 44.7% |
| Cape Verdeans | 100.0 /100 | #9 | Exceptional 44.5% |
| Germans | 100.0 /100 | #10 | Exceptional 44.2% |
| Swedes | 100.0 /100 | #11 | Exceptional 44.1% |
| Finns | 100.0 /100 | #12 | Exceptional 43.9% |
| Dutch | 100.0 /100 | #13 | Exceptional 43.8% |
| Chippewa | 100.0 /100 | #14 | Exceptional 43.8% |
| Slovenes | 100.0 /100 | #15 | Exceptional 43.7% |
| Czechs | 100.0 /100 | #16 | Exceptional 43.6% |
| Scandinavians | 100.0 /100 | #17 | Exceptional 43.6% |
Demographics Similar to Immigrants from Netherlands by In Labor Force | Age 16-19
In terms of in labor force | age 16-19, the demographic groups most similar to Immigrants from Netherlands are Macedonian (37.8%, a difference of 0.060%), Australian (37.8%, a difference of 0.090%), Cajun (37.8%, a difference of 0.090%), Cheyenne (37.9%, a difference of 0.21%), and Immigrants from Oceania (37.9%, a difference of 0.23%).
| Demographics | Rating | Rank | In Labor Force | Age 16-19 |
| Choctaw | 95.6 /100 | #127 | Exceptional 38.0% |
| New Zealanders | 95.6 /100 | #128 | Exceptional 38.0% |
| Spaniards | 95.5 /100 | #129 | Exceptional 38.0% |
| Immigrants | Zimbabwe | 95.4 /100 | #130 | Exceptional 38.0% |
| Immigrants | Austria | 95.0 /100 | #131 | Exceptional 37.9% |
| Immigrants | Oceania | 94.7 /100 | #132 | Exceptional 37.9% |
| Cheyenne | 94.6 /100 | #133 | Exceptional 37.9% |
| Immigrants | Netherlands | 93.7 /100 | #134 | Exceptional 37.8% |
| Macedonians | 93.4 /100 | #135 | Exceptional 37.8% |
| Australians | 93.2 /100 | #136 | Exceptional 37.8% |
| Cajuns | 93.2 /100 | #137 | Exceptional 37.8% |
| Comanche | 91.9 /100 | #138 | Exceptional 37.7% |
| Immigrants | Moldova | 91.9 /100 | #139 | Exceptional 37.7% |
| Estonians | 91.7 /100 | #140 | Exceptional 37.7% |
| Syrians | 90.7 /100 | #141 | Exceptional 37.6% |