Zimbabwean vs Immigrants from Netherlands In Labor Force | Age 16-19
COMPARE
Zimbabwean
Immigrants from Netherlands
In Labor Force | Age 16-19
In Labor Force | Age 16-19 Comparison
Zimbabweans
Immigrants from Netherlands
38.7%
IN LABOR FORCE | AGE 16-19
99.1/ 100
METRIC RATING
102nd/ 347
METRIC RANK
37.8%
IN LABOR FORCE | AGE 16-19
93.7/ 100
METRIC RATING
134th/ 347
METRIC RANK
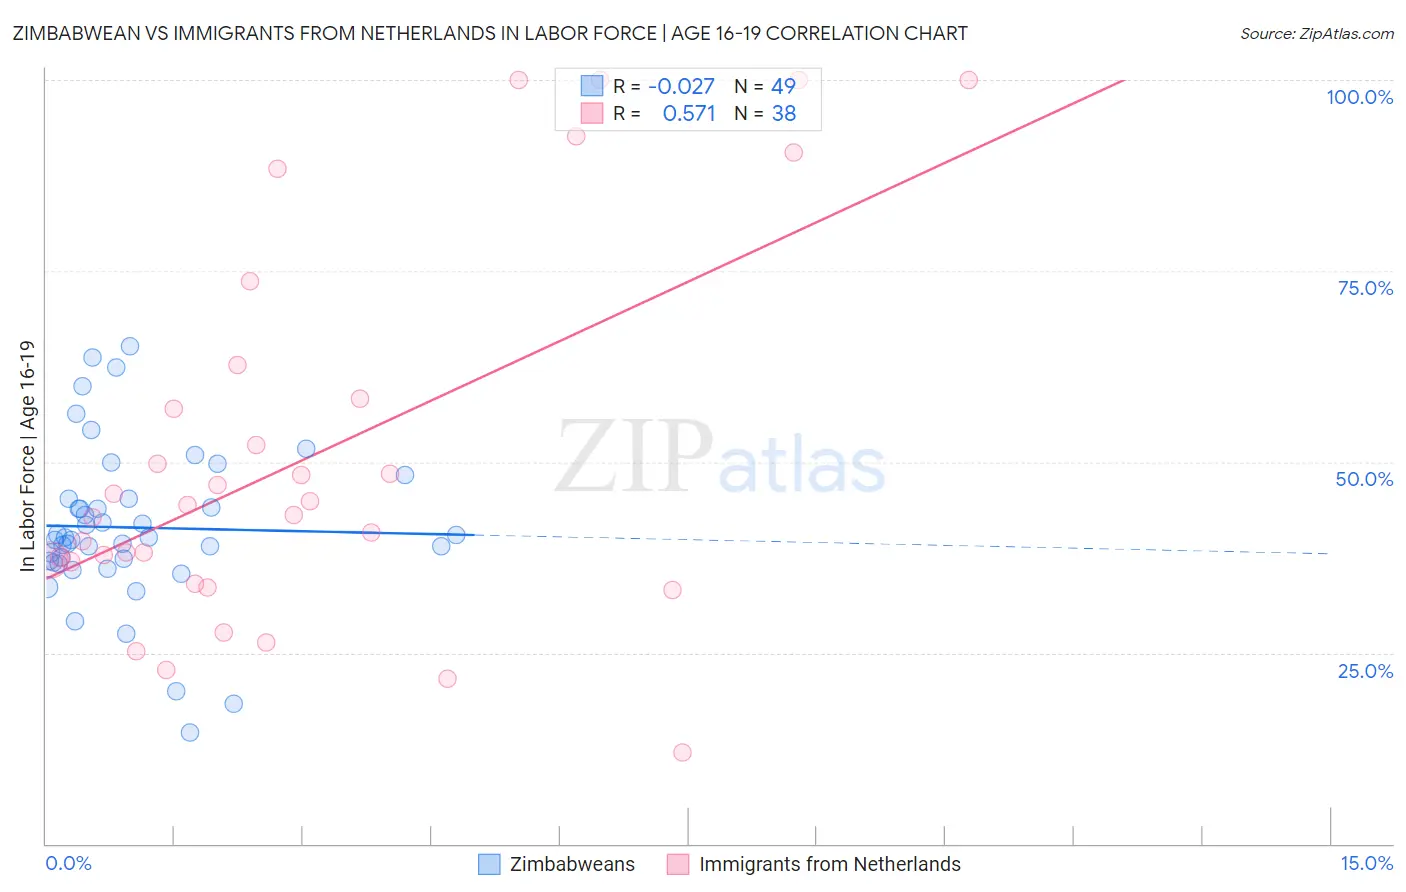
Zimbabwean vs Immigrants from Netherlands In Labor Force | Age 16-19 Correlation Chart
The statistical analysis conducted on geographies consisting of 69,203,596 people shows no correlation between the proportion of Zimbabweans and labor force participation rate among population between the ages 16 and 19 in the United States with a correlation coefficient (R) of -0.027 and weighted average of 38.7%. Similarly, the statistical analysis conducted on geographies consisting of 237,512,378 people shows a substantial positive correlation between the proportion of Immigrants from Netherlands and labor force participation rate among population between the ages 16 and 19 in the United States with a correlation coefficient (R) of 0.571 and weighted average of 37.8%, a difference of 2.4%.
In Labor Force | Age 16-19 Correlation Summary
| Measurement | Zimbabwean | Immigrants from Netherlands |
| Minimum | 14.6% | 12.0% |
| Maximum | 65.2% | 100.0% |
| Range | 50.6% | 88.0% |
| Mean | 41.4% | 50.8% |
| Median | 40.1% | 43.7% |
| Interquartile 25% (IQ1) | 36.9% | 36.9% |
| Interquartile 75% (IQ3) | 45.1% | 58.3% |
| Interquartile Range (IQR) | 8.2% | 21.4% |
| Standard Deviation (Sample) | 10.3% | 24.7% |
| Standard Deviation (Population) | 10.2% | 24.3% |
Similar Demographics by In Labor Force | Age 16-19
Demographics Similar to Zimbabweans by In Labor Force | Age 16-19
In terms of in labor force | age 16-19, the demographic groups most similar to Zimbabweans are Hmong (38.7%, a difference of 0.010%), Immigrants from Cameroon (38.7%, a difference of 0.030%), Immigrants from Thailand (38.7%, a difference of 0.070%), Immigrants from Eritrea (38.7%, a difference of 0.090%), and Iraqi (38.6%, a difference of 0.25%).
| Demographics | Rating | Rank | In Labor Force | Age 16-19 |
| Immigrants | North America | 99.4 /100 | #95 | Exceptional 38.9% |
| Latvians | 99.4 /100 | #96 | Exceptional 38.9% |
| Greeks | 99.3 /100 | #97 | Exceptional 38.9% |
| Ugandans | 99.3 /100 | #98 | Exceptional 38.9% |
| Immigrants | North Macedonia | 99.3 /100 | #99 | Exceptional 38.9% |
| Immigrants | Thailand | 99.1 /100 | #100 | Exceptional 38.7% |
| Hmong | 99.1 /100 | #101 | Exceptional 38.7% |
| Zimbabweans | 99.1 /100 | #102 | Exceptional 38.7% |
| Immigrants | Cameroon | 99.0 /100 | #103 | Exceptional 38.7% |
| Immigrants | Eritrea | 99.0 /100 | #104 | Exceptional 38.7% |
| Iraqis | 98.9 /100 | #105 | Exceptional 38.6% |
| Delaware | 98.8 /100 | #106 | Exceptional 38.6% |
| Chinese | 98.8 /100 | #107 | Exceptional 38.6% |
| Immigrants | Ethiopia | 98.7 /100 | #108 | Exceptional 38.6% |
| Lebanese | 98.7 /100 | #109 | Exceptional 38.6% |
Demographics Similar to Immigrants from Netherlands by In Labor Force | Age 16-19
In terms of in labor force | age 16-19, the demographic groups most similar to Immigrants from Netherlands are Macedonian (37.8%, a difference of 0.060%), Australian (37.8%, a difference of 0.090%), Cajun (37.8%, a difference of 0.090%), Cheyenne (37.9%, a difference of 0.21%), and Immigrants from Oceania (37.9%, a difference of 0.23%).
| Demographics | Rating | Rank | In Labor Force | Age 16-19 |
| Choctaw | 95.6 /100 | #127 | Exceptional 38.0% |
| New Zealanders | 95.6 /100 | #128 | Exceptional 38.0% |
| Spaniards | 95.5 /100 | #129 | Exceptional 38.0% |
| Immigrants | Zimbabwe | 95.4 /100 | #130 | Exceptional 38.0% |
| Immigrants | Austria | 95.0 /100 | #131 | Exceptional 37.9% |
| Immigrants | Oceania | 94.7 /100 | #132 | Exceptional 37.9% |
| Cheyenne | 94.6 /100 | #133 | Exceptional 37.9% |
| Immigrants | Netherlands | 93.7 /100 | #134 | Exceptional 37.8% |
| Macedonians | 93.4 /100 | #135 | Exceptional 37.8% |
| Australians | 93.2 /100 | #136 | Exceptional 37.8% |
| Cajuns | 93.2 /100 | #137 | Exceptional 37.8% |
| Comanche | 91.9 /100 | #138 | Exceptional 37.7% |
| Immigrants | Moldova | 91.9 /100 | #139 | Exceptional 37.7% |
| Estonians | 91.7 /100 | #140 | Exceptional 37.7% |
| Syrians | 90.7 /100 | #141 | Exceptional 37.6% |