Turkish vs Bermudan In Labor Force | Age 35-44
COMPARE
Turkish
Bermudan
In Labor Force | Age 35-44
In Labor Force | Age 35-44 Comparison
Turks
Bermudans
85.1%
IN LABOR FORCE | AGE 35-44
99.5/ 100
METRIC RATING
54th/ 347
METRIC RANK
85.3%
IN LABOR FORCE | AGE 35-44
99.9/ 100
METRIC RATING
30th/ 347
METRIC RANK
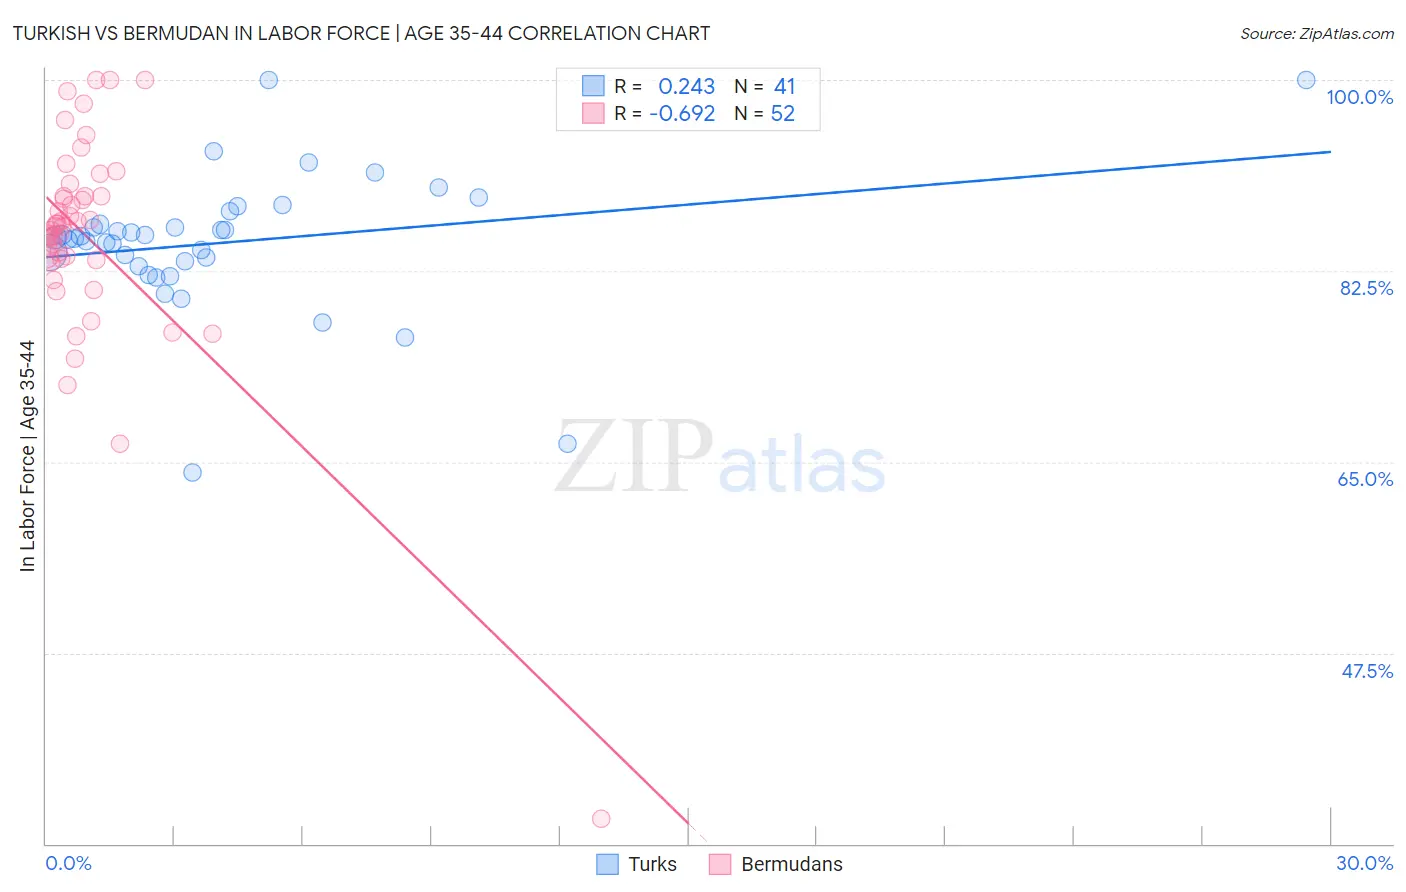
Turkish vs Bermudan In Labor Force | Age 35-44 Correlation Chart
The statistical analysis conducted on geographies consisting of 271,726,396 people shows a weak positive correlation between the proportion of Turks and labor force participation rate among population between the ages 35 and 44 in the United States with a correlation coefficient (R) of 0.243 and weighted average of 85.1%. Similarly, the statistical analysis conducted on geographies consisting of 55,725,453 people shows a significant negative correlation between the proportion of Bermudans and labor force participation rate among population between the ages 35 and 44 in the United States with a correlation coefficient (R) of -0.692 and weighted average of 85.3%, a difference of 0.24%.
In Labor Force | Age 35-44 Correlation Summary
| Measurement | Turkish | Bermudan |
| Minimum | 64.0% | 32.3% |
| Maximum | 100.0% | 100.0% |
| Range | 36.0% | 67.7% |
| Mean | 85.1% | 85.6% |
| Median | 85.5% | 86.6% |
| Interquartile 25% (IQ1) | 83.2% | 83.6% |
| Interquartile 75% (IQ3) | 87.4% | 89.4% |
| Interquartile Range (IQR) | 4.2% | 5.8% |
| Standard Deviation (Sample) | 6.5% | 10.2% |
| Standard Deviation (Population) | 6.4% | 10.1% |
Similar Demographics by In Labor Force | Age 35-44
Demographics Similar to Turks by In Labor Force | Age 35-44
In terms of in labor force | age 35-44, the demographic groups most similar to Turks are Soviet Union (85.1%, a difference of 0.0%), Immigrants from Croatia (85.1%, a difference of 0.010%), Taiwanese (85.1%, a difference of 0.020%), Immigrants from Kenya (85.1%, a difference of 0.030%), and Chinese (85.1%, a difference of 0.030%).
| Demographics | Rating | Rank | In Labor Force | Age 35-44 |
| German Russians | 99.8 /100 | #47 | Exceptional 85.2% |
| Immigrants | Eritrea | 99.7 /100 | #48 | Exceptional 85.2% |
| Croatians | 99.7 /100 | #49 | Exceptional 85.2% |
| Thais | 99.7 /100 | #50 | Exceptional 85.2% |
| Immigrants | Albania | 99.7 /100 | #51 | Exceptional 85.1% |
| Immigrants | Kenya | 99.6 /100 | #52 | Exceptional 85.1% |
| Taiwanese | 99.6 /100 | #53 | Exceptional 85.1% |
| Turks | 99.5 /100 | #54 | Exceptional 85.1% |
| Soviet Union | 99.5 /100 | #55 | Exceptional 85.1% |
| Immigrants | Croatia | 99.5 /100 | #56 | Exceptional 85.1% |
| Chinese | 99.4 /100 | #57 | Exceptional 85.1% |
| Slovaks | 99.4 /100 | #58 | Exceptional 85.1% |
| Serbians | 99.4 /100 | #59 | Exceptional 85.1% |
| Albanians | 99.4 /100 | #60 | Exceptional 85.1% |
| Immigrants | Latvia | 99.3 /100 | #61 | Exceptional 85.0% |
Demographics Similar to Bermudans by In Labor Force | Age 35-44
In terms of in labor force | age 35-44, the demographic groups most similar to Bermudans are Czech (85.3%, a difference of 0.0%), Immigrants from India (85.3%, a difference of 0.0%), Cambodian (85.3%, a difference of 0.010%), Ugandan (85.3%, a difference of 0.010%), and Immigrants from Nepal (85.3%, a difference of 0.040%).
| Demographics | Rating | Rank | In Labor Force | Age 35-44 |
| Immigrants | Eastern Africa | 100.0 /100 | #23 | Exceptional 85.4% |
| Latvians | 99.9 /100 | #24 | Exceptional 85.4% |
| Paraguayans | 99.9 /100 | #25 | Exceptional 85.4% |
| Immigrants | Liberia | 99.9 /100 | #26 | Exceptional 85.4% |
| Immigrants | Lithuania | 99.9 /100 | #27 | Exceptional 85.4% |
| Immigrants | Greece | 99.9 /100 | #28 | Exceptional 85.3% |
| Cambodians | 99.9 /100 | #29 | Exceptional 85.3% |
| Bermudans | 99.9 /100 | #30 | Exceptional 85.3% |
| Czechs | 99.9 /100 | #31 | Exceptional 85.3% |
| Immigrants | India | 99.9 /100 | #32 | Exceptional 85.3% |
| Ugandans | 99.9 /100 | #33 | Exceptional 85.3% |
| Immigrants | Nepal | 99.9 /100 | #34 | Exceptional 85.3% |
| Estonians | 99.9 /100 | #35 | Exceptional 85.3% |
| Immigrants | Morocco | 99.8 /100 | #36 | Exceptional 85.2% |
| Kenyans | 99.8 /100 | #37 | Exceptional 85.2% |