Tsimshian vs Immigrants from Latvia In Labor Force | Age 20-24
COMPARE
Tsimshian
Immigrants from Latvia
In Labor Force | Age 20-24
In Labor Force | Age 20-24 Comparison
Tsimshian
Immigrants from Latvia
72.3%
IN LABOR FORCE | AGE 20-24
0.0/ 100
METRIC RATING
309th/ 347
METRIC RANK
75.0%
IN LABOR FORCE | AGE 20-24
44.1/ 100
METRIC RATING
179th/ 347
METRIC RANK
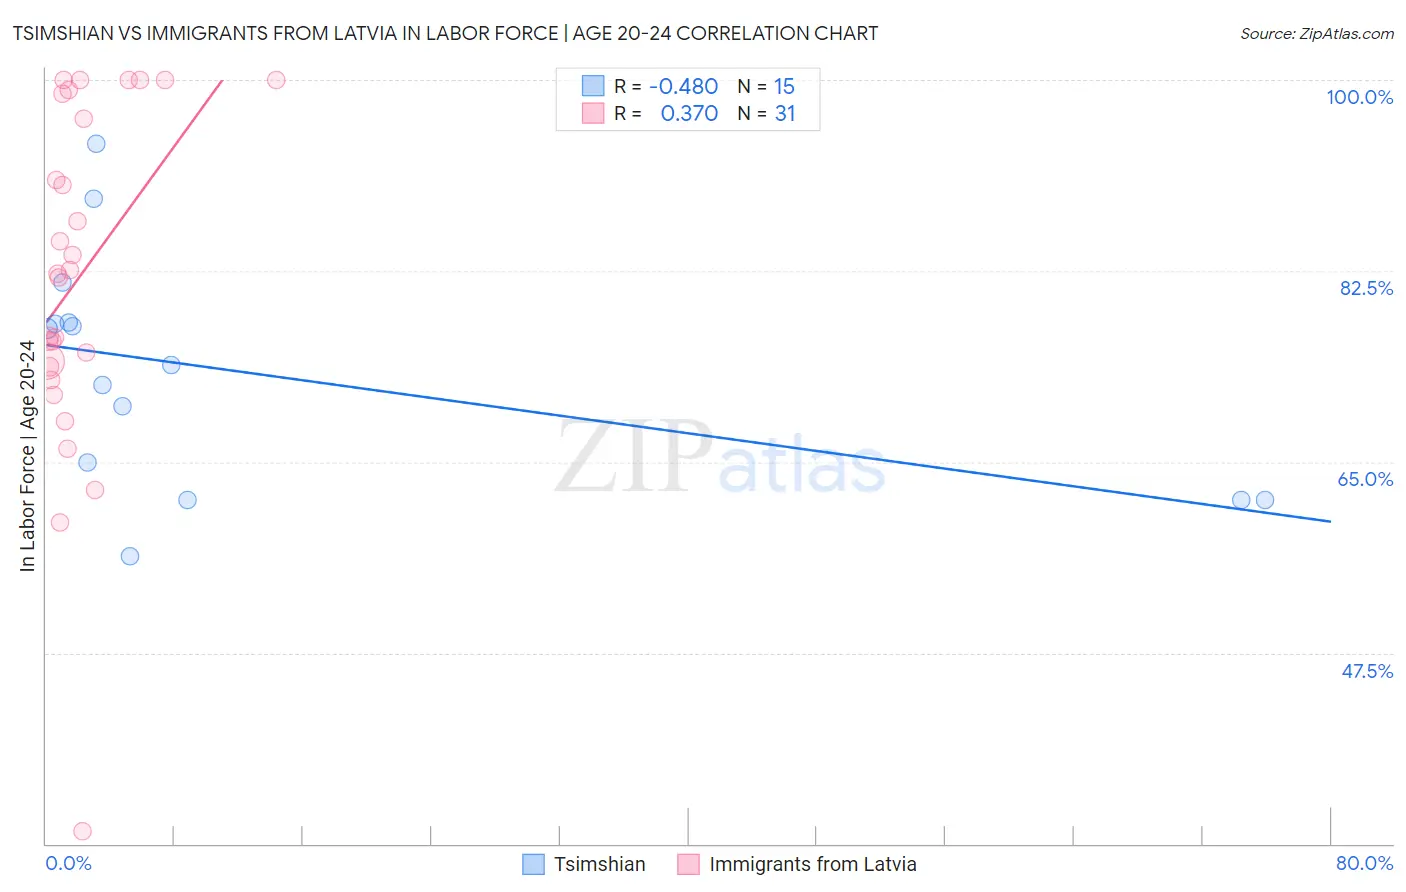
Tsimshian vs Immigrants from Latvia In Labor Force | Age 20-24 Correlation Chart
The statistical analysis conducted on geographies consisting of 15,626,462 people shows a moderate negative correlation between the proportion of Tsimshian and labor force participation rate among population between the ages 20 and 24 in the United States with a correlation coefficient (R) of -0.480 and weighted average of 72.3%. Similarly, the statistical analysis conducted on geographies consisting of 113,730,913 people shows a mild positive correlation between the proportion of Immigrants from Latvia and labor force participation rate among population between the ages 20 and 24 in the United States with a correlation coefficient (R) of 0.370 and weighted average of 75.0%, a difference of 3.8%.
In Labor Force | Age 20-24 Correlation Summary
| Measurement | Tsimshian | Immigrants from Latvia |
| Minimum | 56.3% | 31.2% |
| Maximum | 94.1% | 100.0% |
| Range | 37.8% | 68.8% |
| Mean | 73.1% | 81.9% |
| Median | 73.9% | 82.3% |
| Interquartile 25% (IQ1) | 61.5% | 73.7% |
| Interquartile 75% (IQ3) | 77.8% | 98.7% |
| Interquartile Range (IQR) | 16.3% | 25.0% |
| Standard Deviation (Sample) | 10.7% | 15.6% |
| Standard Deviation (Population) | 10.4% | 15.4% |
Similar Demographics by In Labor Force | Age 20-24
Demographics Similar to Tsimshian by In Labor Force | Age 20-24
In terms of in labor force | age 20-24, the demographic groups most similar to Tsimshian are Soviet Union (72.3%, a difference of 0.0%), Immigrants from Ecuador (72.3%, a difference of 0.010%), Immigrants from Jamaica (72.4%, a difference of 0.16%), Immigrants from Singapore (72.4%, a difference of 0.19%), and Immigrants from West Indies (72.4%, a difference of 0.21%).
| Demographics | Rating | Rank | In Labor Force | Age 20-24 |
| Natives/Alaskans | 0.0 /100 | #302 | Tragic 72.4% |
| Ecuadorians | 0.0 /100 | #303 | Tragic 72.4% |
| Immigrants | West Indies | 0.0 /100 | #304 | Tragic 72.4% |
| Immigrants | Singapore | 0.0 /100 | #305 | Tragic 72.4% |
| Immigrants | Jamaica | 0.0 /100 | #306 | Tragic 72.4% |
| Immigrants | Ecuador | 0.0 /100 | #307 | Tragic 72.3% |
| Soviet Union | 0.0 /100 | #308 | Tragic 72.3% |
| Tsimshian | 0.0 /100 | #309 | Tragic 72.3% |
| Immigrants | Cuba | 0.0 /100 | #310 | Tragic 72.0% |
| Apache | 0.0 /100 | #311 | Tragic 72.0% |
| Immigrants | Caribbean | 0.0 /100 | #312 | Tragic 71.9% |
| Immigrants | Dominica | 0.0 /100 | #313 | Tragic 71.9% |
| Indians (Asian) | 0.0 /100 | #314 | Tragic 71.9% |
| Immigrants | Iran | 0.0 /100 | #315 | Tragic 71.8% |
| Immigrants | Eastern Asia | 0.0 /100 | #316 | Tragic 71.8% |
Demographics Similar to Immigrants from Latvia by In Labor Force | Age 20-24
In terms of in labor force | age 20-24, the demographic groups most similar to Immigrants from Latvia are Immigrants from Czechoslovakia (75.0%, a difference of 0.0%), Immigrants from Central America (75.0%, a difference of 0.010%), African (75.0%, a difference of 0.020%), Immigrants from Mexico (75.0%, a difference of 0.060%), and Central American (75.0%, a difference of 0.070%).
| Demographics | Rating | Rank | In Labor Force | Age 20-24 |
| Yakama | 50.8 /100 | #172 | Average 75.1% |
| Immigrants | Croatia | 50.2 /100 | #173 | Average 75.1% |
| South Africans | 50.0 /100 | #174 | Average 75.0% |
| Syrians | 49.5 /100 | #175 | Average 75.0% |
| Central Americans | 48.7 /100 | #176 | Average 75.0% |
| Immigrants | Mexico | 47.8 /100 | #177 | Average 75.0% |
| Immigrants | Central America | 45.0 /100 | #178 | Average 75.0% |
| Immigrants | Latvia | 44.1 /100 | #179 | Average 75.0% |
| Immigrants | Czechoslovakia | 44.0 /100 | #180 | Average 75.0% |
| Africans | 42.5 /100 | #181 | Average 75.0% |
| Immigrants | South Africa | 36.9 /100 | #182 | Fair 74.9% |
| Immigrants | Costa Rica | 36.7 /100 | #183 | Fair 74.9% |
| Immigrants | Hungary | 35.0 /100 | #184 | Fair 74.9% |
| Sri Lankans | 34.9 /100 | #185 | Fair 74.9% |
| Immigrants | Eastern Europe | 33.8 /100 | #186 | Fair 74.9% |