Croatian vs Immigrants from Latvia In Labor Force | Age 20-24
COMPARE
Croatian
Immigrants from Latvia
In Labor Force | Age 20-24
In Labor Force | Age 20-24 Comparison
Croatians
Immigrants from Latvia
77.2%
IN LABOR FORCE | AGE 20-24
100.0/ 100
METRIC RATING
51st/ 347
METRIC RANK
75.0%
IN LABOR FORCE | AGE 20-24
44.1/ 100
METRIC RATING
179th/ 347
METRIC RANK
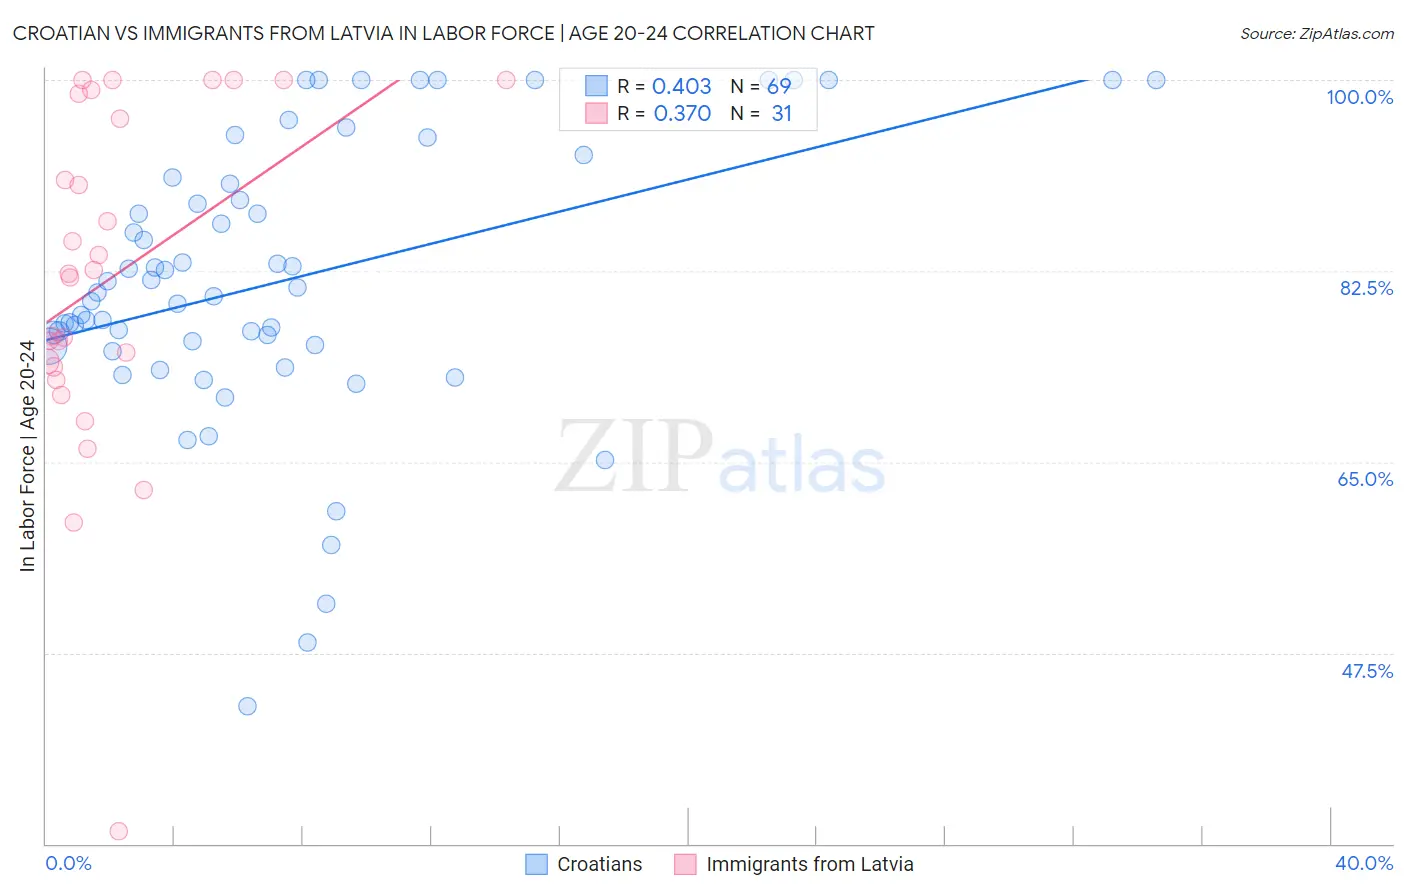
Croatian vs Immigrants from Latvia In Labor Force | Age 20-24 Correlation Chart
The statistical analysis conducted on geographies consisting of 375,516,771 people shows a moderate positive correlation between the proportion of Croatians and labor force participation rate among population between the ages 20 and 24 in the United States with a correlation coefficient (R) of 0.403 and weighted average of 77.2%. Similarly, the statistical analysis conducted on geographies consisting of 113,730,913 people shows a mild positive correlation between the proportion of Immigrants from Latvia and labor force participation rate among population between the ages 20 and 24 in the United States with a correlation coefficient (R) of 0.370 and weighted average of 75.0%, a difference of 3.0%.
In Labor Force | Age 20-24 Correlation Summary
| Measurement | Croatian | Immigrants from Latvia |
| Minimum | 42.6% | 31.2% |
| Maximum | 100.0% | 100.0% |
| Range | 57.4% | 68.8% |
| Mean | 81.6% | 81.9% |
| Median | 80.5% | 82.3% |
| Interquartile 25% (IQ1) | 75.7% | 73.7% |
| Interquartile 75% (IQ3) | 90.7% | 98.7% |
| Interquartile Range (IQR) | 15.1% | 25.0% |
| Standard Deviation (Sample) | 12.8% | 15.6% |
| Standard Deviation (Population) | 12.7% | 15.4% |
Similar Demographics by In Labor Force | Age 20-24
Demographics Similar to Croatians by In Labor Force | Age 20-24
In terms of in labor force | age 20-24, the demographic groups most similar to Croatians are Malaysian (77.2%, a difference of 0.010%), Indonesian (77.2%, a difference of 0.010%), Immigrants from the Azores (77.2%, a difference of 0.020%), Chinese (77.3%, a difference of 0.050%), and Serbian (77.3%, a difference of 0.060%).
| Demographics | Rating | Rank | In Labor Force | Age 20-24 |
| Fijians | 100.0 /100 | #44 | Exceptional 77.4% |
| Native Hawaiians | 100.0 /100 | #45 | Exceptional 77.4% |
| Samoans | 100.0 /100 | #46 | Exceptional 77.4% |
| Ethiopians | 100.0 /100 | #47 | Exceptional 77.3% |
| Serbians | 100.0 /100 | #48 | Exceptional 77.3% |
| Chinese | 100.0 /100 | #49 | Exceptional 77.3% |
| Malaysians | 100.0 /100 | #50 | Exceptional 77.2% |
| Croatians | 100.0 /100 | #51 | Exceptional 77.2% |
| Indonesians | 100.0 /100 | #52 | Exceptional 77.2% |
| Immigrants | Azores | 100.0 /100 | #53 | Exceptional 77.2% |
| Celtics | 99.9 /100 | #54 | Exceptional 77.1% |
| Immigrants | Liberia | 99.9 /100 | #55 | Exceptional 77.1% |
| Europeans | 99.9 /100 | #56 | Exceptional 77.1% |
| Chippewa | 99.9 /100 | #57 | Exceptional 77.1% |
| Hawaiians | 99.9 /100 | #58 | Exceptional 77.0% |
Demographics Similar to Immigrants from Latvia by In Labor Force | Age 20-24
In terms of in labor force | age 20-24, the demographic groups most similar to Immigrants from Latvia are Immigrants from Czechoslovakia (75.0%, a difference of 0.0%), Immigrants from Central America (75.0%, a difference of 0.010%), African (75.0%, a difference of 0.020%), Immigrants from Mexico (75.0%, a difference of 0.060%), and Central American (75.0%, a difference of 0.070%).
| Demographics | Rating | Rank | In Labor Force | Age 20-24 |
| Yakama | 50.8 /100 | #172 | Average 75.1% |
| Immigrants | Croatia | 50.2 /100 | #173 | Average 75.1% |
| South Africans | 50.0 /100 | #174 | Average 75.0% |
| Syrians | 49.5 /100 | #175 | Average 75.0% |
| Central Americans | 48.7 /100 | #176 | Average 75.0% |
| Immigrants | Mexico | 47.8 /100 | #177 | Average 75.0% |
| Immigrants | Central America | 45.0 /100 | #178 | Average 75.0% |
| Immigrants | Latvia | 44.1 /100 | #179 | Average 75.0% |
| Immigrants | Czechoslovakia | 44.0 /100 | #180 | Average 75.0% |
| Africans | 42.5 /100 | #181 | Average 75.0% |
| Immigrants | South Africa | 36.9 /100 | #182 | Fair 74.9% |
| Immigrants | Costa Rica | 36.7 /100 | #183 | Fair 74.9% |
| Immigrants | Hungary | 35.0 /100 | #184 | Fair 74.9% |
| Sri Lankans | 34.9 /100 | #185 | Fair 74.9% |
| Immigrants | Eastern Europe | 33.8 /100 | #186 | Fair 74.9% |