Immigrants from China vs Immigrants from Latvia In Labor Force | Age 20-24
COMPARE
Immigrants from China
Immigrants from Latvia
In Labor Force | Age 20-24
In Labor Force | Age 20-24 Comparison
Immigrants from China
Immigrants from Latvia
71.1%
IN LABOR FORCE | AGE 20-24
0.0/ 100
METRIC RATING
328th/ 347
METRIC RANK
75.0%
IN LABOR FORCE | AGE 20-24
44.1/ 100
METRIC RATING
179th/ 347
METRIC RANK
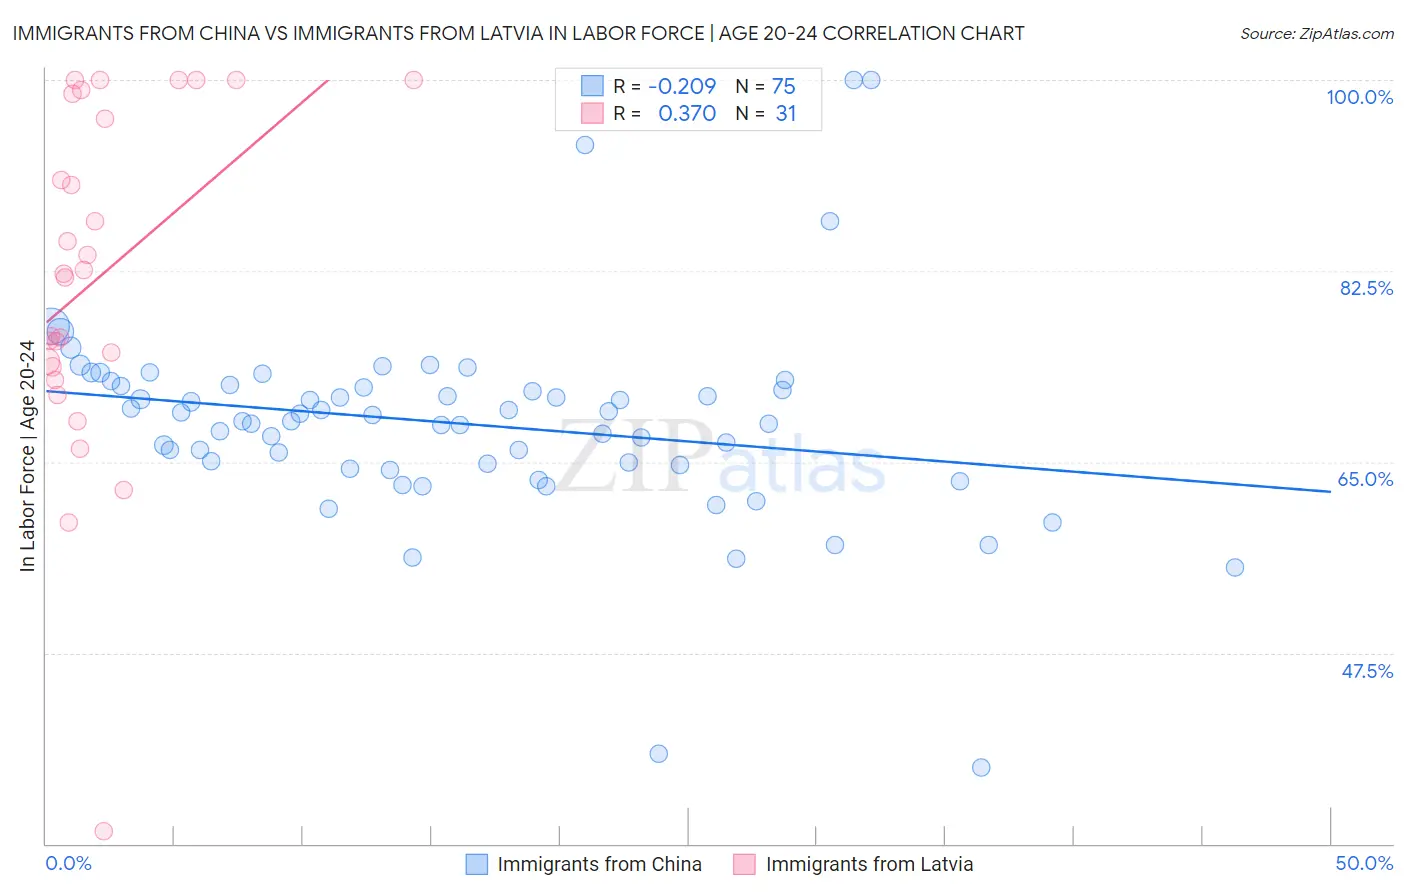
Immigrants from China vs Immigrants from Latvia In Labor Force | Age 20-24 Correlation Chart
The statistical analysis conducted on geographies consisting of 456,875,563 people shows a weak negative correlation between the proportion of Immigrants from China and labor force participation rate among population between the ages 20 and 24 in the United States with a correlation coefficient (R) of -0.209 and weighted average of 71.1%. Similarly, the statistical analysis conducted on geographies consisting of 113,730,913 people shows a mild positive correlation between the proportion of Immigrants from Latvia and labor force participation rate among population between the ages 20 and 24 in the United States with a correlation coefficient (R) of 0.370 and weighted average of 75.0%, a difference of 5.5%.
In Labor Force | Age 20-24 Correlation Summary
| Measurement | Immigrants from China | Immigrants from Latvia |
| Minimum | 37.0% | 31.2% |
| Maximum | 100.0% | 100.0% |
| Range | 63.0% | 68.8% |
| Mean | 68.5% | 81.9% |
| Median | 68.8% | 82.3% |
| Interquartile 25% (IQ1) | 64.7% | 73.7% |
| Interquartile 75% (IQ3) | 71.9% | 98.7% |
| Interquartile Range (IQR) | 7.3% | 25.0% |
| Standard Deviation (Sample) | 9.5% | 15.6% |
| Standard Deviation (Population) | 9.4% | 15.4% |
Similar Demographics by In Labor Force | Age 20-24
Demographics Similar to Immigrants from China by In Labor Force | Age 20-24
In terms of in labor force | age 20-24, the demographic groups most similar to Immigrants from China are Dominican (71.1%, a difference of 0.020%), Immigrants from Trinidad and Tobago (71.1%, a difference of 0.020%), Barbadian (71.1%, a difference of 0.10%), Immigrants from Dominican Republic (71.2%, a difference of 0.21%), and Yup'ik (70.9%, a difference of 0.24%).
| Demographics | Rating | Rank | In Labor Force | Age 20-24 |
| Immigrants | Taiwan | 0.0 /100 | #321 | Tragic 71.5% |
| Filipinos | 0.0 /100 | #322 | Tragic 71.4% |
| West Indians | 0.0 /100 | #323 | Tragic 71.3% |
| Immigrants | Dominican Republic | 0.0 /100 | #324 | Tragic 71.2% |
| Barbadians | 0.0 /100 | #325 | Tragic 71.1% |
| Dominicans | 0.0 /100 | #326 | Tragic 71.1% |
| Immigrants | Trinidad and Tobago | 0.0 /100 | #327 | Tragic 71.1% |
| Immigrants | China | 0.0 /100 | #328 | Tragic 71.1% |
| Yup'ik | 0.0 /100 | #329 | Tragic 70.9% |
| Vietnamese | 0.0 /100 | #330 | Tragic 70.6% |
| Immigrants | Bangladesh | 0.0 /100 | #331 | Tragic 70.6% |
| Immigrants | Uzbekistan | 0.0 /100 | #332 | Tragic 70.4% |
| Yuman | 0.0 /100 | #333 | Tragic 70.3% |
| British West Indians | 0.0 /100 | #334 | Tragic 70.0% |
| Immigrants | Barbados | 0.0 /100 | #335 | Tragic 69.7% |
Demographics Similar to Immigrants from Latvia by In Labor Force | Age 20-24
In terms of in labor force | age 20-24, the demographic groups most similar to Immigrants from Latvia are Immigrants from Czechoslovakia (75.0%, a difference of 0.0%), Immigrants from Central America (75.0%, a difference of 0.010%), African (75.0%, a difference of 0.020%), Immigrants from Mexico (75.0%, a difference of 0.060%), and Central American (75.0%, a difference of 0.070%).
| Demographics | Rating | Rank | In Labor Force | Age 20-24 |
| Yakama | 50.8 /100 | #172 | Average 75.1% |
| Immigrants | Croatia | 50.2 /100 | #173 | Average 75.1% |
| South Africans | 50.0 /100 | #174 | Average 75.0% |
| Syrians | 49.5 /100 | #175 | Average 75.0% |
| Central Americans | 48.7 /100 | #176 | Average 75.0% |
| Immigrants | Mexico | 47.8 /100 | #177 | Average 75.0% |
| Immigrants | Central America | 45.0 /100 | #178 | Average 75.0% |
| Immigrants | Latvia | 44.1 /100 | #179 | Average 75.0% |
| Immigrants | Czechoslovakia | 44.0 /100 | #180 | Average 75.0% |
| Africans | 42.5 /100 | #181 | Average 75.0% |
| Immigrants | South Africa | 36.9 /100 | #182 | Fair 74.9% |
| Immigrants | Costa Rica | 36.7 /100 | #183 | Fair 74.9% |
| Immigrants | Hungary | 35.0 /100 | #184 | Fair 74.9% |
| Sri Lankans | 34.9 /100 | #185 | Fair 74.9% |
| Immigrants | Eastern Europe | 33.8 /100 | #186 | Fair 74.9% |