Tsimshian vs Czechoslovakian In Labor Force | Age 25-29
COMPARE
Tsimshian
Czechoslovakian
In Labor Force | Age 25-29
In Labor Force | Age 25-29 Comparison
Tsimshian
Czechoslovakians
88.7%
IN LABOR FORCE | AGE 25-29
100.0/ 100
METRIC RATING
1st/ 347
METRIC RANK
85.0%
IN LABOR FORCE | AGE 25-29
92.6/ 100
METRIC RATING
106th/ 347
METRIC RANK
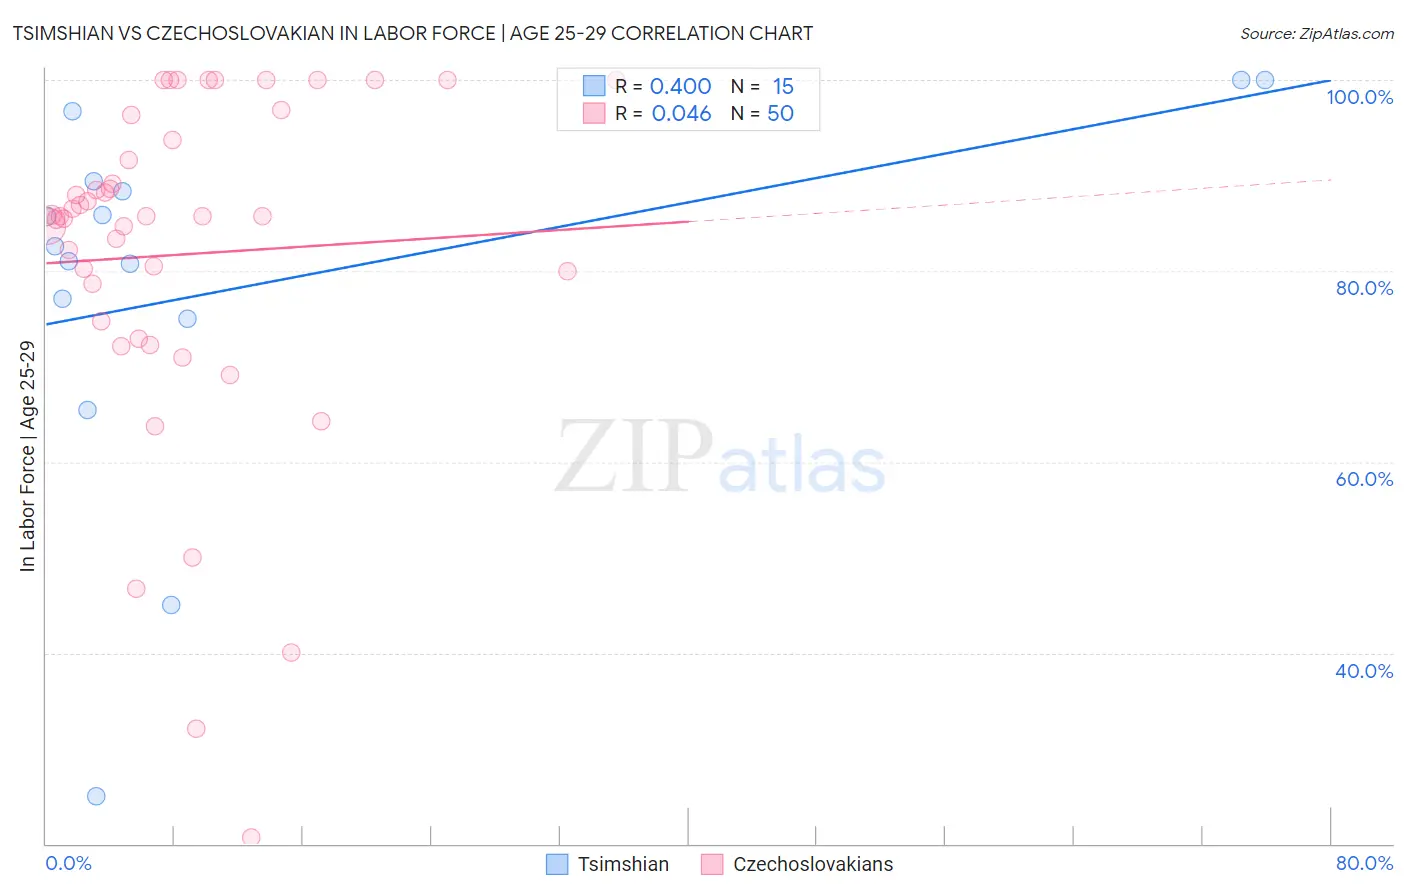
Tsimshian vs Czechoslovakian In Labor Force | Age 25-29 Correlation Chart
The statistical analysis conducted on geographies consisting of 15,624,837 people shows a mild positive correlation between the proportion of Tsimshian and labor force participation rate among population between the ages 25 and 29 in the United States with a correlation coefficient (R) of 0.400 and weighted average of 88.7%. Similarly, the statistical analysis conducted on geographies consisting of 368,503,594 people shows no correlation between the proportion of Czechoslovakians and labor force participation rate among population between the ages 25 and 29 in the United States with a correlation coefficient (R) of 0.046 and weighted average of 85.0%, a difference of 4.3%.
In Labor Force | Age 25-29 Correlation Summary
| Measurement | Tsimshian | Czechoslovakian |
| Minimum | 25.0% | 20.6% |
| Maximum | 100.0% | 100.0% |
| Range | 75.0% | 79.4% |
| Mean | 78.5% | 81.7% |
| Median | 82.5% | 85.7% |
| Interquartile 25% (IQ1) | 75.0% | 74.7% |
| Interquartile 75% (IQ3) | 89.4% | 93.7% |
| Interquartile Range (IQR) | 14.4% | 19.1% |
| Standard Deviation (Sample) | 20.3% | 18.0% |
| Standard Deviation (Population) | 19.6% | 17.8% |
Similar Demographics by In Labor Force | Age 25-29
Demographics Similar to Tsimshian by In Labor Force | Age 25-29
In terms of in labor force | age 25-29, the demographic groups most similar to Tsimshian are Immigrants from Somalia (87.1%, a difference of 1.8%), Somali (87.1%, a difference of 1.8%), Carpatho Rusyn (87.0%, a difference of 1.9%), Luxembourger (86.9%, a difference of 2.0%), and Slovene (86.4%, a difference of 2.7%).
| Demographics | Rating | Rank | In Labor Force | Age 25-29 |
| Tsimshian | 100.0 /100 | #1 | Exceptional 88.7% |
| Immigrants | Somalia | 100.0 /100 | #2 | Exceptional 87.1% |
| Somalis | 100.0 /100 | #3 | Exceptional 87.1% |
| Carpatho Rusyns | 100.0 /100 | #4 | Exceptional 87.0% |
| Luxembourgers | 100.0 /100 | #5 | Exceptional 86.9% |
| Slovenes | 100.0 /100 | #6 | Exceptional 86.4% |
| Immigrants | Bosnia and Herzegovina | 100.0 /100 | #7 | Exceptional 86.3% |
| Immigrants | Cabo Verde | 100.0 /100 | #8 | Exceptional 86.2% |
| Ethiopians | 100.0 /100 | #9 | Exceptional 86.2% |
| Liberians | 100.0 /100 | #10 | Exceptional 86.1% |
| Immigrants | Ethiopia | 100.0 /100 | #11 | Exceptional 86.1% |
| Immigrants | Lithuania | 100.0 /100 | #12 | Exceptional 86.1% |
| Norwegians | 100.0 /100 | #13 | Exceptional 86.1% |
| Latvians | 100.0 /100 | #14 | Exceptional 86.1% |
| Bolivians | 100.0 /100 | #15 | Exceptional 86.1% |
Demographics Similar to Czechoslovakians by In Labor Force | Age 25-29
In terms of in labor force | age 25-29, the demographic groups most similar to Czechoslovakians are Immigrants from Hong Kong (85.0%, a difference of 0.0%), Immigrants from Southern Europe (85.0%, a difference of 0.010%), Immigrants from Zaire (85.1%, a difference of 0.020%), Immigrants from Austria (85.0%, a difference of 0.020%), and Costa Rican (85.0%, a difference of 0.020%).
| Demographics | Rating | Rank | In Labor Force | Age 25-29 |
| Bangladeshis | 94.0 /100 | #99 | Exceptional 85.1% |
| Immigrants | Switzerland | 93.9 /100 | #100 | Exceptional 85.1% |
| Egyptians | 93.8 /100 | #101 | Exceptional 85.1% |
| Slavs | 93.7 /100 | #102 | Exceptional 85.1% |
| Immigrants | Japan | 93.5 /100 | #103 | Exceptional 85.1% |
| Immigrants | Zaire | 93.3 /100 | #104 | Exceptional 85.1% |
| Immigrants | Hong Kong | 92.8 /100 | #105 | Exceptional 85.0% |
| Czechoslovakians | 92.6 /100 | #106 | Exceptional 85.0% |
| Immigrants | Southern Europe | 92.3 /100 | #107 | Exceptional 85.0% |
| Immigrants | Austria | 91.9 /100 | #108 | Exceptional 85.0% |
| Costa Ricans | 91.9 /100 | #109 | Exceptional 85.0% |
| New Zealanders | 91.5 /100 | #110 | Exceptional 85.0% |
| Immigrants | Middle Africa | 91.4 /100 | #111 | Exceptional 85.0% |
| Senegalese | 90.9 /100 | #112 | Exceptional 85.0% |
| Irish | 90.6 /100 | #113 | Exceptional 85.0% |