Asian vs Immigrants from Belgium In Labor Force | Age 25-29
COMPARE
Asian
Immigrants from Belgium
In Labor Force | Age 25-29
In Labor Force | Age 25-29 Comparison
Asians
Immigrants from Belgium
84.8%
IN LABOR FORCE | AGE 25-29
77.7/ 100
METRIC RATING
133rd/ 347
METRIC RANK
84.6%
IN LABOR FORCE | AGE 25-29
35.0/ 100
METRIC RATING
186th/ 347
METRIC RANK
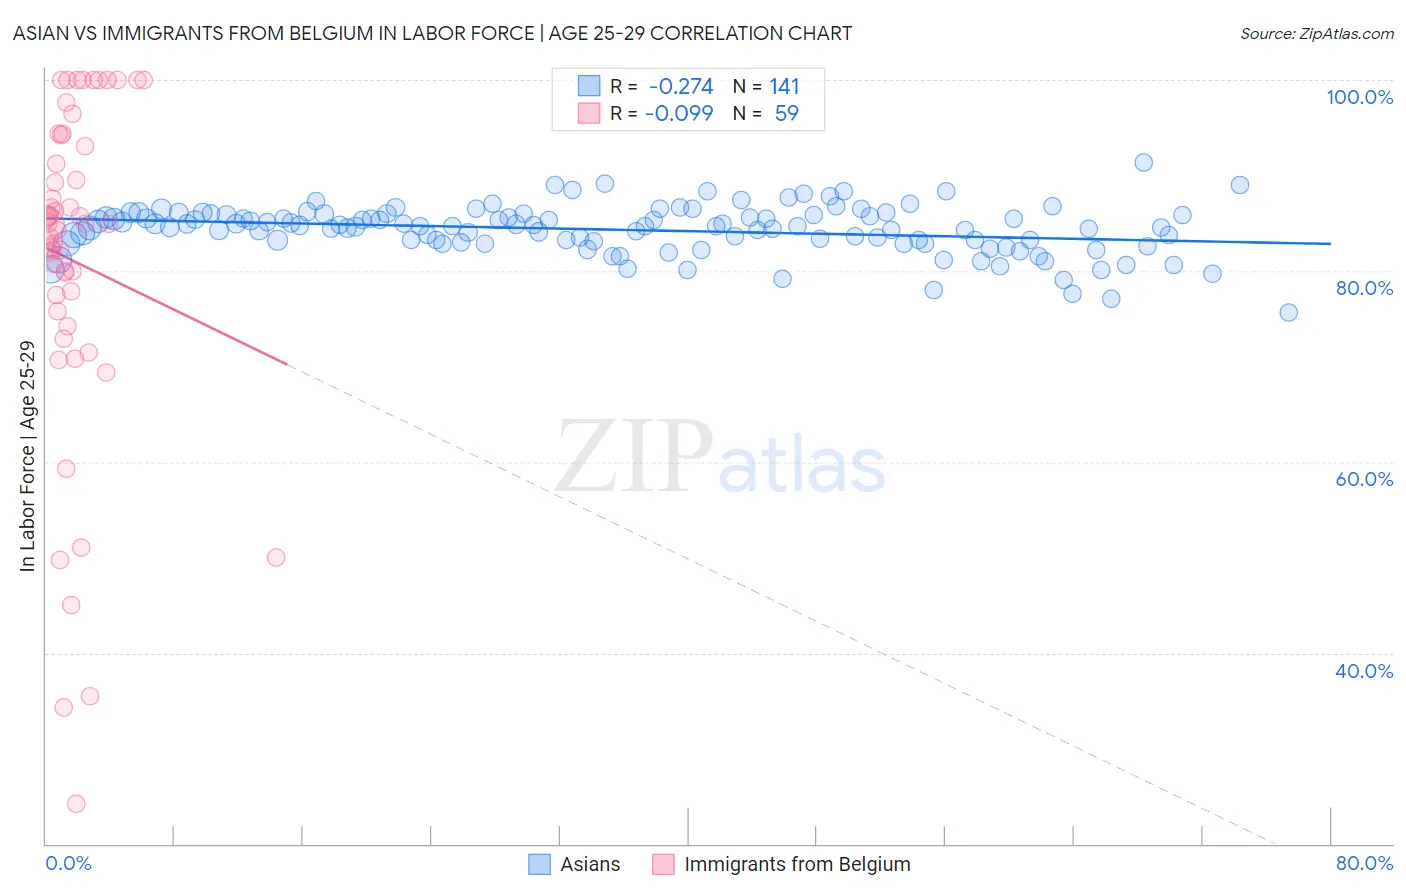
Asian vs Immigrants from Belgium In Labor Force | Age 25-29 Correlation Chart
The statistical analysis conducted on geographies consisting of 550,144,058 people shows a weak negative correlation between the proportion of Asians and labor force participation rate among population between the ages 25 and 29 in the United States with a correlation coefficient (R) of -0.274 and weighted average of 84.8%. Similarly, the statistical analysis conducted on geographies consisting of 146,686,004 people shows a slight negative correlation between the proportion of Immigrants from Belgium and labor force participation rate among population between the ages 25 and 29 in the United States with a correlation coefficient (R) of -0.099 and weighted average of 84.6%, a difference of 0.34%.
In Labor Force | Age 25-29 Correlation Summary
| Measurement | Asian | Immigrants from Belgium |
| Minimum | 75.7% | 24.2% |
| Maximum | 91.4% | 100.0% |
| Range | 15.7% | 75.8% |
| Mean | 84.3% | 81.0% |
| Median | 84.7% | 85.0% |
| Interquartile 25% (IQ1) | 83.0% | 75.8% |
| Interquartile 75% (IQ3) | 85.9% | 94.2% |
| Interquartile Range (IQR) | 2.8% | 18.4% |
| Standard Deviation (Sample) | 2.5% | 17.6% |
| Standard Deviation (Population) | 2.5% | 17.5% |
Similar Demographics by In Labor Force | Age 25-29
Demographics Similar to Asians by In Labor Force | Age 25-29
In terms of in labor force | age 25-29, the demographic groups most similar to Asians are Iranian (84.8%, a difference of 0.0%), Romanian (84.8%, a difference of 0.0%), Syrian (84.8%, a difference of 0.010%), Immigrants from Hungary (84.8%, a difference of 0.010%), and Bhutanese (84.8%, a difference of 0.020%).
| Demographics | Rating | Rank | In Labor Force | Age 25-29 |
| Immigrants | Singapore | 84.4 /100 | #126 | Excellent 84.9% |
| Immigrants | Uruguay | 84.0 /100 | #127 | Excellent 84.9% |
| Australians | 83.6 /100 | #128 | Excellent 84.9% |
| Immigrants | Russia | 81.6 /100 | #129 | Excellent 84.9% |
| Northern Europeans | 81.3 /100 | #130 | Excellent 84.9% |
| Iranians | 78.1 /100 | #131 | Good 84.8% |
| Romanians | 77.7 /100 | #132 | Good 84.8% |
| Asians | 77.7 /100 | #133 | Good 84.8% |
| Syrians | 76.5 /100 | #134 | Good 84.8% |
| Immigrants | Hungary | 76.4 /100 | #135 | Good 84.8% |
| Bhutanese | 76.0 /100 | #136 | Good 84.8% |
| Immigrants | Canada | 73.5 /100 | #137 | Good 84.8% |
| Armenians | 72.7 /100 | #138 | Good 84.8% |
| Immigrants | Eastern Asia | 72.6 /100 | #139 | Good 84.8% |
| Immigrants | North America | 72.1 /100 | #140 | Good 84.8% |
Demographics Similar to Immigrants from Belgium by In Labor Force | Age 25-29
In terms of in labor force | age 25-29, the demographic groups most similar to Immigrants from Belgium are Immigrants from Portugal (84.6%, a difference of 0.0%), Immigrants from Ukraine (84.5%, a difference of 0.010%), Immigrants from Denmark (84.6%, a difference of 0.020%), Moroccan (84.5%, a difference of 0.020%), and Immigrants from Kuwait (84.6%, a difference of 0.030%).
| Demographics | Rating | Rank | In Labor Force | Age 25-29 |
| Immigrants | Argentina | 44.0 /100 | #179 | Average 84.6% |
| Immigrants | South America | 42.9 /100 | #180 | Average 84.6% |
| Immigrants | Norway | 41.9 /100 | #181 | Average 84.6% |
| Europeans | 40.3 /100 | #182 | Average 84.6% |
| Scottish | 40.1 /100 | #183 | Average 84.6% |
| Immigrants | Kuwait | 38.2 /100 | #184 | Fair 84.6% |
| Immigrants | Denmark | 37.0 /100 | #185 | Fair 84.6% |
| Immigrants | Belgium | 35.0 /100 | #186 | Fair 84.6% |
| Immigrants | Portugal | 34.7 /100 | #187 | Fair 84.6% |
| Immigrants | Ukraine | 33.7 /100 | #188 | Fair 84.5% |
| Moroccans | 32.6 /100 | #189 | Fair 84.5% |
| Welsh | 31.1 /100 | #190 | Fair 84.5% |
| Zimbabweans | 28.7 /100 | #191 | Fair 84.5% |
| English | 25.8 /100 | #192 | Fair 84.5% |
| South American Indians | 25.0 /100 | #193 | Fair 84.5% |