Tsimshian vs Alaskan Athabascan In Labor Force | Age 45-54
COMPARE
Tsimshian
Alaskan Athabascan
In Labor Force | Age 45-54
In Labor Force | Age 45-54 Comparison
Tsimshian
Alaskan Athabascans
77.4%
IN LABOR FORCE | AGE 45-54
0.0/ 100
METRIC RATING
331st/ 347
METRIC RANK
81.8%
IN LABOR FORCE | AGE 45-54
0.4/ 100
METRIC RATING
246th/ 347
METRIC RANK
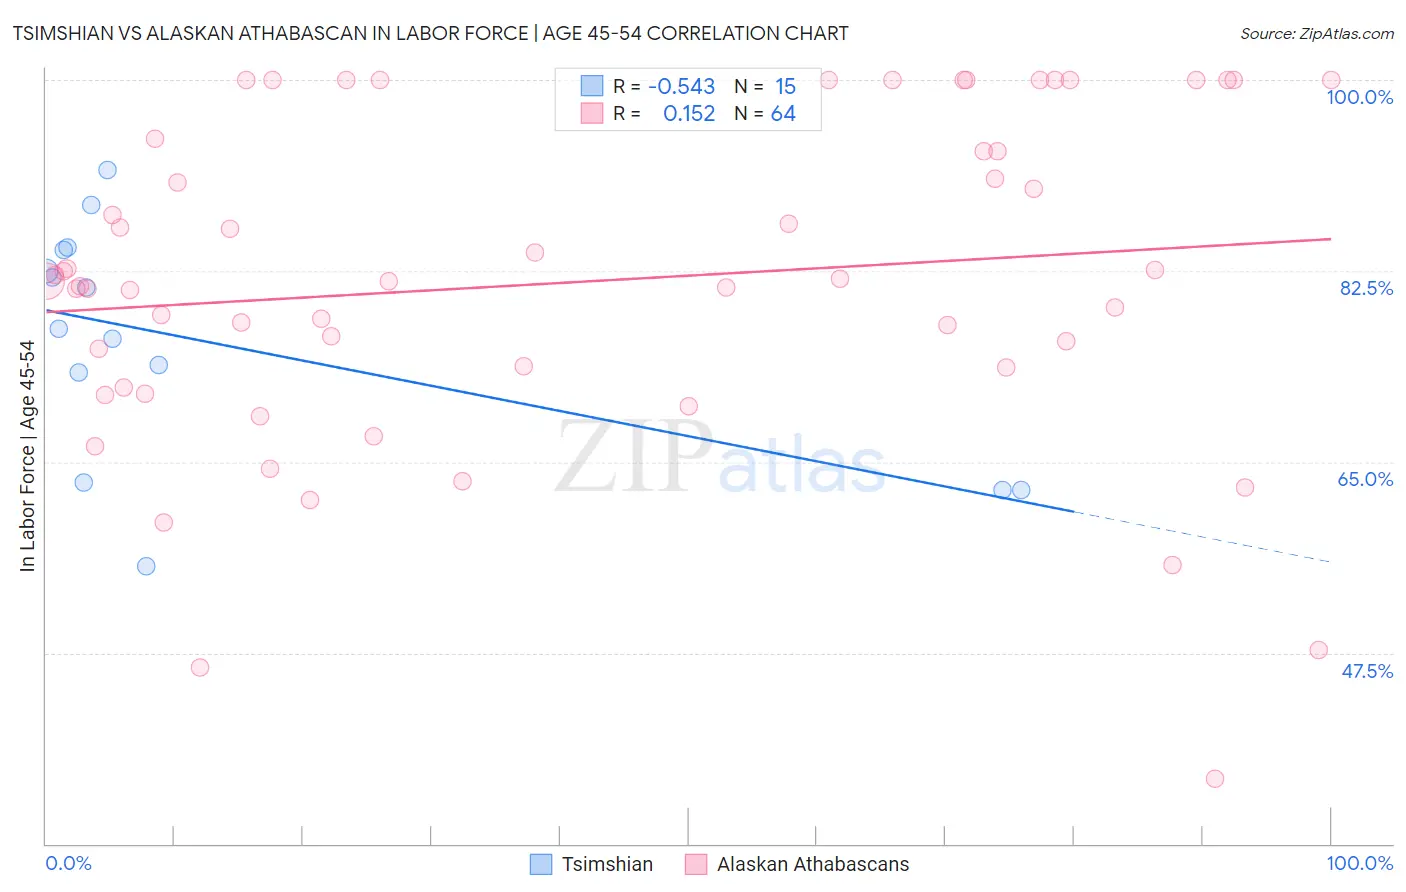
Tsimshian vs Alaskan Athabascan In Labor Force | Age 45-54 Correlation Chart
The statistical analysis conducted on geographies consisting of 15,626,261 people shows a substantial negative correlation between the proportion of Tsimshian and labor force participation rate among population between the ages 45 and 54 in the United States with a correlation coefficient (R) of -0.543 and weighted average of 77.4%. Similarly, the statistical analysis conducted on geographies consisting of 45,818,095 people shows a poor positive correlation between the proportion of Alaskan Athabascans and labor force participation rate among population between the ages 45 and 54 in the United States with a correlation coefficient (R) of 0.152 and weighted average of 81.8%, a difference of 5.6%.
In Labor Force | Age 45-54 Correlation Summary
| Measurement | Tsimshian | Alaskan Athabascan |
| Minimum | 55.4% | 36.0% |
| Maximum | 91.8% | 100.0% |
| Range | 36.4% | 64.0% |
| Mean | 75.9% | 81.5% |
| Median | 77.2% | 81.5% |
| Interquartile 25% (IQ1) | 63.1% | 72.8% |
| Interquartile 75% (IQ3) | 84.5% | 94.1% |
| Interquartile Range (IQR) | 21.4% | 21.3% |
| Standard Deviation (Sample) | 10.8% | 15.0% |
| Standard Deviation (Population) | 10.4% | 14.9% |
Similar Demographics by In Labor Force | Age 45-54
Demographics Similar to Tsimshian by In Labor Force | Age 45-54
In terms of in labor force | age 45-54, the demographic groups most similar to Tsimshian are Menominee (77.4%, a difference of 0.030%), Cheyenne (77.6%, a difference of 0.15%), Creek (77.7%, a difference of 0.37%), Native/Alaskan (77.1%, a difference of 0.39%), and Apache (77.1%, a difference of 0.39%).
| Demographics | Rating | Rank | In Labor Force | Age 45-54 |
| Dutch West Indians | 0.0 /100 | #324 | Tragic 78.2% |
| Choctaw | 0.0 /100 | #325 | Tragic 78.2% |
| Seminole | 0.0 /100 | #326 | Tragic 78.1% |
| Cajuns | 0.0 /100 | #327 | Tragic 78.1% |
| Sioux | 0.0 /100 | #328 | Tragic 78.0% |
| Creek | 0.0 /100 | #329 | Tragic 77.7% |
| Cheyenne | 0.0 /100 | #330 | Tragic 77.6% |
| Tsimshian | 0.0 /100 | #331 | Tragic 77.4% |
| Menominee | 0.0 /100 | #332 | Tragic 77.4% |
| Natives/Alaskans | 0.0 /100 | #333 | Tragic 77.1% |
| Apache | 0.0 /100 | #334 | Tragic 77.1% |
| Arapaho | 0.0 /100 | #335 | Tragic 77.1% |
| Paiute | 0.0 /100 | #336 | Tragic 76.7% |
| Ute | 0.0 /100 | #337 | Tragic 76.6% |
| Yuman | 0.0 /100 | #338 | Tragic 76.3% |
Demographics Similar to Alaskan Athabascans by In Labor Force | Age 45-54
In terms of in labor force | age 45-54, the demographic groups most similar to Alaskan Athabascans are Alaska Native (81.8%, a difference of 0.010%), Celtic (81.8%, a difference of 0.020%), Central American (81.7%, a difference of 0.020%), Puget Sound Salish (81.7%, a difference of 0.040%), and Hmong (81.7%, a difference of 0.060%).
| Demographics | Rating | Rank | In Labor Force | Age 45-54 |
| Immigrants | Thailand | 1.0 /100 | #239 | Tragic 81.9% |
| Immigrants | El Salvador | 1.0 /100 | #240 | Tragic 81.9% |
| Immigrants | Cambodia | 0.8 /100 | #241 | Tragic 81.9% |
| Whites/Caucasians | 0.7 /100 | #242 | Tragic 81.9% |
| Samoans | 0.6 /100 | #243 | Tragic 81.8% |
| Celtics | 0.4 /100 | #244 | Tragic 81.8% |
| Alaska Natives | 0.4 /100 | #245 | Tragic 81.8% |
| Alaskan Athabascans | 0.4 /100 | #246 | Tragic 81.8% |
| Central Americans | 0.4 /100 | #247 | Tragic 81.7% |
| Puget Sound Salish | 0.3 /100 | #248 | Tragic 81.7% |
| Hmong | 0.3 /100 | #249 | Tragic 81.7% |
| Immigrants | Armenia | 0.2 /100 | #250 | Tragic 81.7% |
| Guamanians/Chamorros | 0.2 /100 | #251 | Tragic 81.6% |
| Pennsylvania Germans | 0.2 /100 | #252 | Tragic 81.6% |
| Japanese | 0.2 /100 | #253 | Tragic 81.6% |