Immigrants from Lebanon vs Alaskan Athabascan In Labor Force | Age 45-54
COMPARE
Immigrants from Lebanon
Alaskan Athabascan
In Labor Force | Age 45-54
In Labor Force | Age 45-54 Comparison
Immigrants from Lebanon
Alaskan Athabascans
82.3%
IN LABOR FORCE | AGE 45-54
7.4/ 100
METRIC RATING
209th/ 347
METRIC RANK
81.8%
IN LABOR FORCE | AGE 45-54
0.4/ 100
METRIC RATING
246th/ 347
METRIC RANK
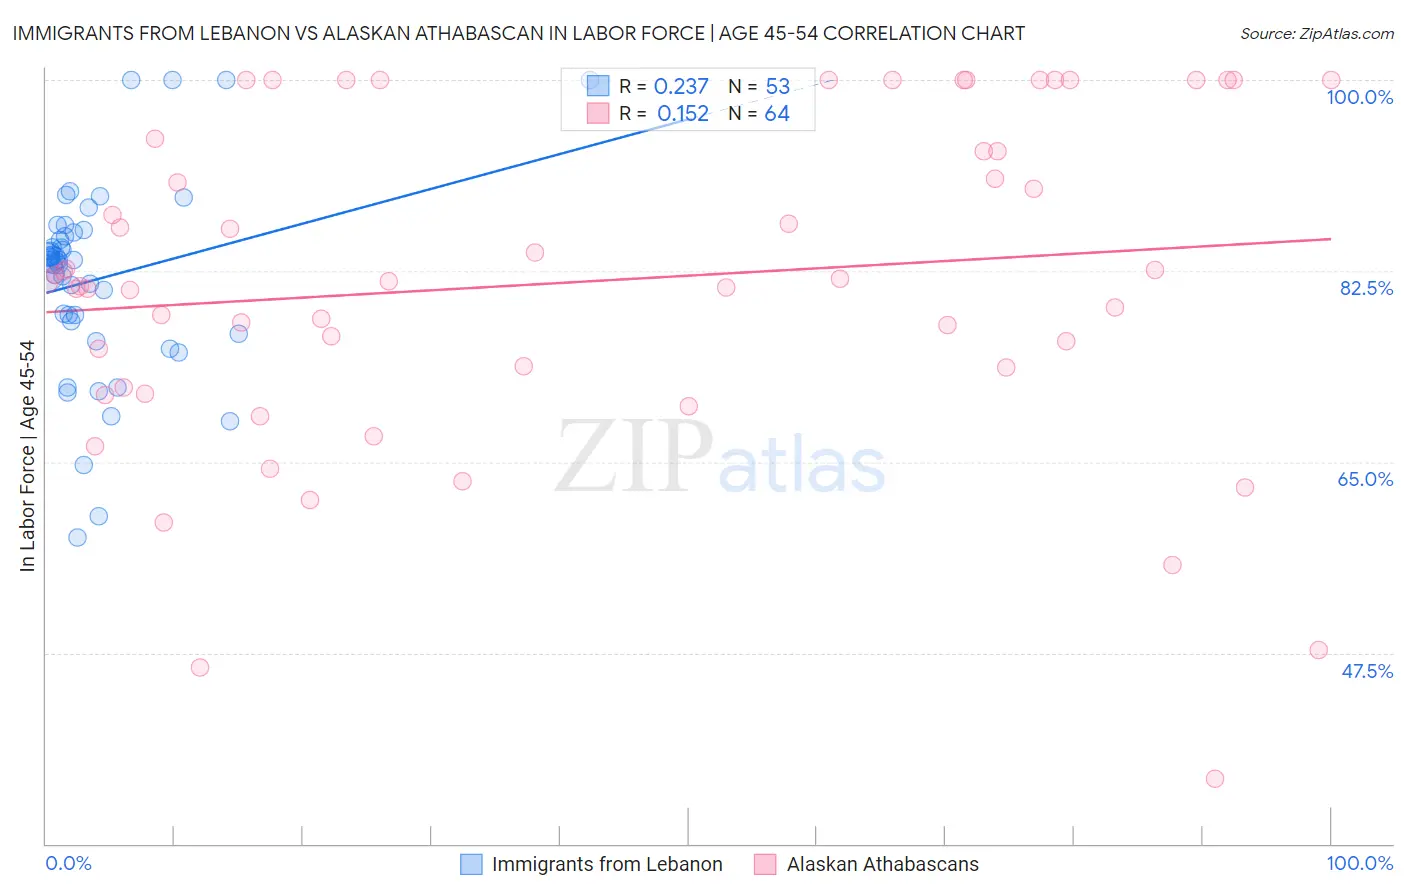
Immigrants from Lebanon vs Alaskan Athabascan In Labor Force | Age 45-54 Correlation Chart
The statistical analysis conducted on geographies consisting of 217,118,694 people shows a weak positive correlation between the proportion of Immigrants from Lebanon and labor force participation rate among population between the ages 45 and 54 in the United States with a correlation coefficient (R) of 0.237 and weighted average of 82.3%. Similarly, the statistical analysis conducted on geographies consisting of 45,818,095 people shows a poor positive correlation between the proportion of Alaskan Athabascans and labor force participation rate among population between the ages 45 and 54 in the United States with a correlation coefficient (R) of 0.152 and weighted average of 81.8%, a difference of 0.67%.
In Labor Force | Age 45-54 Correlation Summary
| Measurement | Immigrants from Lebanon | Alaskan Athabascan |
| Minimum | 58.1% | 36.0% |
| Maximum | 100.0% | 100.0% |
| Range | 41.9% | 64.0% |
| Mean | 81.8% | 81.5% |
| Median | 83.4% | 81.5% |
| Interquartile 25% (IQ1) | 77.3% | 72.8% |
| Interquartile 75% (IQ3) | 85.8% | 94.1% |
| Interquartile Range (IQR) | 8.5% | 21.3% |
| Standard Deviation (Sample) | 8.8% | 15.0% |
| Standard Deviation (Population) | 8.7% | 14.9% |
Similar Demographics by In Labor Force | Age 45-54
Demographics Similar to Immigrants from Lebanon by In Labor Force | Age 45-54
In terms of in labor force | age 45-54, the demographic groups most similar to Immigrants from Lebanon are Immigrants from Bahamas (82.3%, a difference of 0.010%), Native Hawaiian (82.3%, a difference of 0.030%), Immigrants from Syria (82.3%, a difference of 0.030%), Immigrants from Cabo Verde (82.3%, a difference of 0.040%), and Ecuadorian (82.3%, a difference of 0.040%).
| Demographics | Rating | Rank | In Labor Force | Age 45-54 |
| Immigrants | Western Asia | 14.9 /100 | #202 | Poor 82.4% |
| Arabs | 11.6 /100 | #203 | Poor 82.4% |
| Immigrants | Western Europe | 10.9 /100 | #204 | Poor 82.4% |
| Senegalese | 9.5 /100 | #205 | Tragic 82.4% |
| Welsh | 9.2 /100 | #206 | Tragic 82.3% |
| Immigrants | Cabo Verde | 8.6 /100 | #207 | Tragic 82.3% |
| Native Hawaiians | 8.5 /100 | #208 | Tragic 82.3% |
| Immigrants | Lebanon | 7.4 /100 | #209 | Tragic 82.3% |
| Immigrants | Bahamas | 7.1 /100 | #210 | Tragic 82.3% |
| Immigrants | Syria | 6.6 /100 | #211 | Tragic 82.3% |
| Ecuadorians | 6.3 /100 | #212 | Tragic 82.3% |
| Immigrants | Uzbekistan | 5.8 /100 | #213 | Tragic 82.3% |
| Immigrants | Panama | 5.6 /100 | #214 | Tragic 82.2% |
| Iraqis | 5.6 /100 | #215 | Tragic 82.2% |
| Scottish | 5.3 /100 | #216 | Tragic 82.2% |
Demographics Similar to Alaskan Athabascans by In Labor Force | Age 45-54
In terms of in labor force | age 45-54, the demographic groups most similar to Alaskan Athabascans are Alaska Native (81.8%, a difference of 0.010%), Celtic (81.8%, a difference of 0.020%), Central American (81.7%, a difference of 0.020%), Puget Sound Salish (81.7%, a difference of 0.040%), and Hmong (81.7%, a difference of 0.060%).
| Demographics | Rating | Rank | In Labor Force | Age 45-54 |
| Immigrants | Thailand | 1.0 /100 | #239 | Tragic 81.9% |
| Immigrants | El Salvador | 1.0 /100 | #240 | Tragic 81.9% |
| Immigrants | Cambodia | 0.8 /100 | #241 | Tragic 81.9% |
| Whites/Caucasians | 0.7 /100 | #242 | Tragic 81.9% |
| Samoans | 0.6 /100 | #243 | Tragic 81.8% |
| Celtics | 0.4 /100 | #244 | Tragic 81.8% |
| Alaska Natives | 0.4 /100 | #245 | Tragic 81.8% |
| Alaskan Athabascans | 0.4 /100 | #246 | Tragic 81.8% |
| Central Americans | 0.4 /100 | #247 | Tragic 81.7% |
| Puget Sound Salish | 0.3 /100 | #248 | Tragic 81.7% |
| Hmong | 0.3 /100 | #249 | Tragic 81.7% |
| Immigrants | Armenia | 0.2 /100 | #250 | Tragic 81.7% |
| Guamanians/Chamorros | 0.2 /100 | #251 | Tragic 81.6% |
| Pennsylvania Germans | 0.2 /100 | #252 | Tragic 81.6% |
| Japanese | 0.2 /100 | #253 | Tragic 81.6% |