Yuman vs Alaskan Athabascan In Labor Force | Age 45-54
COMPARE
Yuman
Alaskan Athabascan
In Labor Force | Age 45-54
In Labor Force | Age 45-54 Comparison
Yuman
Alaskan Athabascans
76.3%
IN LABOR FORCE | AGE 45-54
0.0/ 100
METRIC RATING
338th/ 347
METRIC RANK
81.8%
IN LABOR FORCE | AGE 45-54
0.4/ 100
METRIC RATING
246th/ 347
METRIC RANK
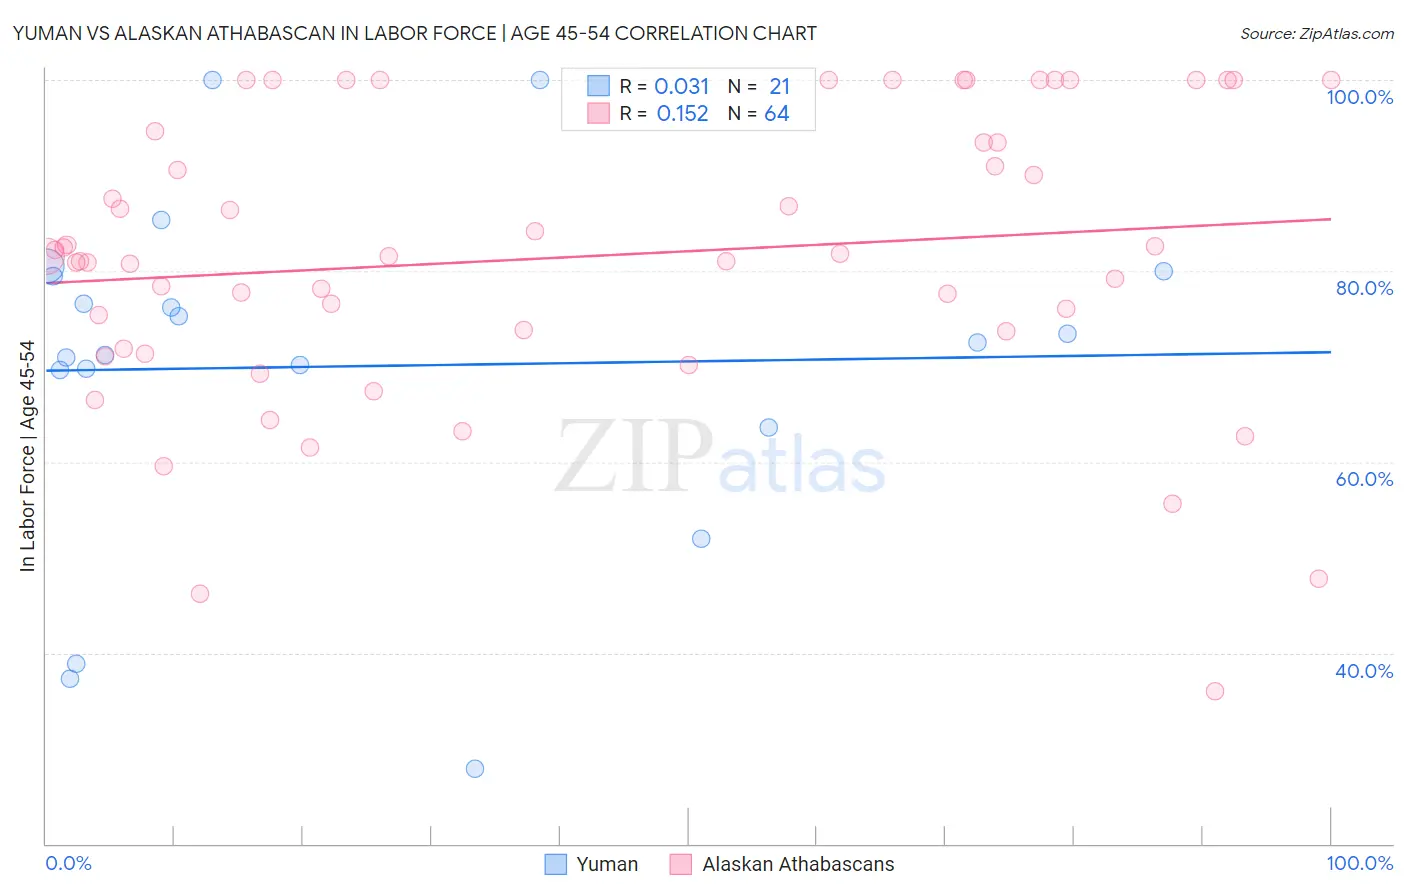
Yuman vs Alaskan Athabascan In Labor Force | Age 45-54 Correlation Chart
The statistical analysis conducted on geographies consisting of 40,663,251 people shows no correlation between the proportion of Yuman and labor force participation rate among population between the ages 45 and 54 in the United States with a correlation coefficient (R) of 0.031 and weighted average of 76.3%. Similarly, the statistical analysis conducted on geographies consisting of 45,818,095 people shows a poor positive correlation between the proportion of Alaskan Athabascans and labor force participation rate among population between the ages 45 and 54 in the United States with a correlation coefficient (R) of 0.152 and weighted average of 81.8%, a difference of 7.1%.
In Labor Force | Age 45-54 Correlation Summary
| Measurement | Yuman | Alaskan Athabascan |
| Minimum | 27.8% | 36.0% |
| Maximum | 100.0% | 100.0% |
| Range | 72.2% | 64.0% |
| Mean | 70.0% | 81.5% |
| Median | 72.5% | 81.5% |
| Interquartile 25% (IQ1) | 66.6% | 72.8% |
| Interquartile 75% (IQ3) | 79.7% | 94.1% |
| Interquartile Range (IQR) | 13.1% | 21.3% |
| Standard Deviation (Sample) | 18.2% | 15.0% |
| Standard Deviation (Population) | 17.8% | 14.9% |
Similar Demographics by In Labor Force | Age 45-54
Demographics Similar to Yuman by In Labor Force | Age 45-54
In terms of in labor force | age 45-54, the demographic groups most similar to Yuman are Ute (76.6%, a difference of 0.41%), Paiute (76.7%, a difference of 0.47%), Puerto Rican (75.9%, a difference of 0.48%), Lumbee (75.6%, a difference of 0.95%), and Arapaho (77.1%, a difference of 1.0%).
| Demographics | Rating | Rank | In Labor Force | Age 45-54 |
| Tsimshian | 0.0 /100 | #331 | Tragic 77.4% |
| Menominee | 0.0 /100 | #332 | Tragic 77.4% |
| Natives/Alaskans | 0.0 /100 | #333 | Tragic 77.1% |
| Apache | 0.0 /100 | #334 | Tragic 77.1% |
| Arapaho | 0.0 /100 | #335 | Tragic 77.1% |
| Paiute | 0.0 /100 | #336 | Tragic 76.7% |
| Ute | 0.0 /100 | #337 | Tragic 76.6% |
| Yuman | 0.0 /100 | #338 | Tragic 76.3% |
| Puerto Ricans | 0.0 /100 | #339 | Tragic 75.9% |
| Lumbee | 0.0 /100 | #340 | Tragic 75.6% |
| Pueblo | 0.0 /100 | #341 | Tragic 75.5% |
| Tohono O'odham | 0.0 /100 | #342 | Tragic 75.1% |
| Hopi | 0.0 /100 | #343 | Tragic 75.0% |
| Immigrants | Yemen | 0.0 /100 | #344 | Tragic 74.4% |
| Houma | 0.0 /100 | #345 | Tragic 74.1% |
Demographics Similar to Alaskan Athabascans by In Labor Force | Age 45-54
In terms of in labor force | age 45-54, the demographic groups most similar to Alaskan Athabascans are Alaska Native (81.8%, a difference of 0.010%), Celtic (81.8%, a difference of 0.020%), Central American (81.7%, a difference of 0.020%), Puget Sound Salish (81.7%, a difference of 0.040%), and Hmong (81.7%, a difference of 0.060%).
| Demographics | Rating | Rank | In Labor Force | Age 45-54 |
| Immigrants | Thailand | 1.0 /100 | #239 | Tragic 81.9% |
| Immigrants | El Salvador | 1.0 /100 | #240 | Tragic 81.9% |
| Immigrants | Cambodia | 0.8 /100 | #241 | Tragic 81.9% |
| Whites/Caucasians | 0.7 /100 | #242 | Tragic 81.9% |
| Samoans | 0.6 /100 | #243 | Tragic 81.8% |
| Celtics | 0.4 /100 | #244 | Tragic 81.8% |
| Alaska Natives | 0.4 /100 | #245 | Tragic 81.8% |
| Alaskan Athabascans | 0.4 /100 | #246 | Tragic 81.8% |
| Central Americans | 0.4 /100 | #247 | Tragic 81.7% |
| Puget Sound Salish | 0.3 /100 | #248 | Tragic 81.7% |
| Hmong | 0.3 /100 | #249 | Tragic 81.7% |
| Immigrants | Armenia | 0.2 /100 | #250 | Tragic 81.7% |
| Guamanians/Chamorros | 0.2 /100 | #251 | Tragic 81.6% |
| Pennsylvania Germans | 0.2 /100 | #252 | Tragic 81.6% |
| Japanese | 0.2 /100 | #253 | Tragic 81.6% |