Trinidadian and Tobagonian vs Belizean In Labor Force | Age 30-34
COMPARE
Trinidadian and Tobagonian
Belizean
In Labor Force | Age 30-34
In Labor Force | Age 30-34 Comparison
Trinidadians and Tobagonians
Belizeans
84.5%
IN LABOR FORCE | AGE 30-34
18.2/ 100
METRIC RATING
201st/ 347
METRIC RANK
83.5%
IN LABOR FORCE | AGE 30-34
0.0/ 100
METRIC RATING
274th/ 347
METRIC RANK
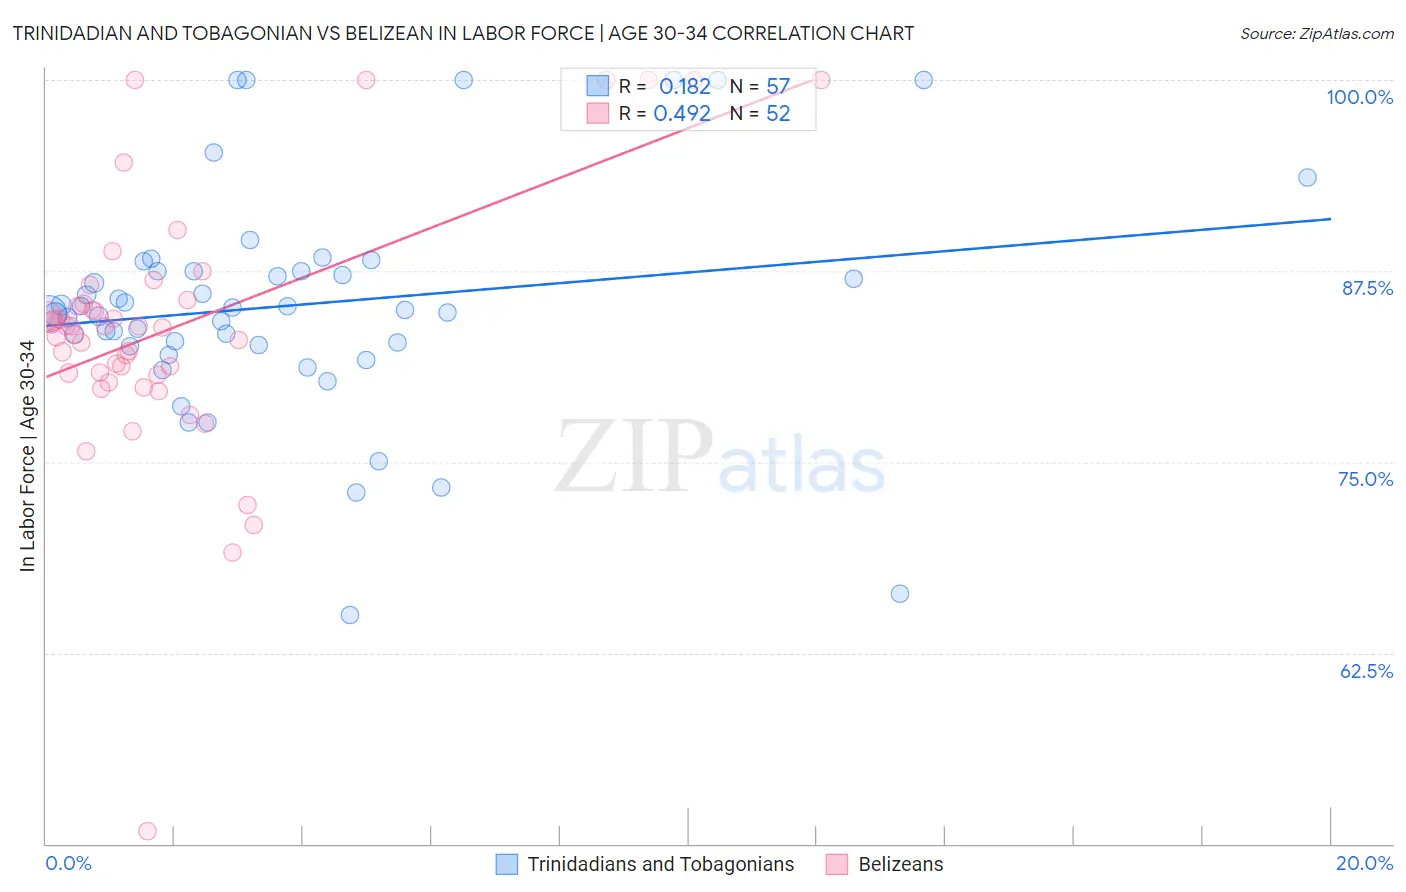
Trinidadian and Tobagonian vs Belizean In Labor Force | Age 30-34 Correlation Chart
The statistical analysis conducted on geographies consisting of 219,758,716 people shows a poor positive correlation between the proportion of Trinidadians and Tobagonians and labor force participation rate among population between the ages 30 and 34 in the United States with a correlation coefficient (R) of 0.182 and weighted average of 84.5%. Similarly, the statistical analysis conducted on geographies consisting of 144,194,456 people shows a moderate positive correlation between the proportion of Belizeans and labor force participation rate among population between the ages 30 and 34 in the United States with a correlation coefficient (R) of 0.492 and weighted average of 83.5%, a difference of 1.2%.
In Labor Force | Age 30-34 Correlation Summary
| Measurement | Trinidadian and Tobagonian | Belizean |
| Minimum | 65.0% | 50.8% |
| Maximum | 100.0% | 100.0% |
| Range | 35.0% | 49.2% |
| Mean | 85.3% | 83.8% |
| Median | 84.9% | 83.8% |
| Interquartile 25% (IQ1) | 82.6% | 80.8% |
| Interquartile 75% (IQ3) | 87.5% | 85.5% |
| Interquartile Range (IQR) | 4.9% | 4.7% |
| Standard Deviation (Sample) | 7.3% | 8.5% |
| Standard Deviation (Population) | 7.3% | 8.4% |
Similar Demographics by In Labor Force | Age 30-34
Demographics Similar to Trinidadians and Tobagonians by In Labor Force | Age 30-34
In terms of in labor force | age 30-34, the demographic groups most similar to Trinidadians and Tobagonians are Immigrants from West Indies (84.5%, a difference of 0.0%), Immigrants from Thailand (84.5%, a difference of 0.010%), Subsaharan African (84.5%, a difference of 0.010%), Dutch (84.5%, a difference of 0.020%), and Canadian (84.4%, a difference of 0.030%).
| Demographics | Rating | Rank | In Labor Force | Age 30-34 |
| Immigrants | Afghanistan | 23.5 /100 | #194 | Fair 84.5% |
| Koreans | 23.2 /100 | #195 | Fair 84.5% |
| British | 22.9 /100 | #196 | Fair 84.5% |
| Immigrants | Syria | 21.9 /100 | #197 | Fair 84.5% |
| Dutch | 20.2 /100 | #198 | Fair 84.5% |
| Immigrants | Thailand | 19.1 /100 | #199 | Poor 84.5% |
| Sub-Saharan Africans | 19.0 /100 | #200 | Poor 84.5% |
| Trinidadians and Tobagonians | 18.2 /100 | #201 | Poor 84.5% |
| Immigrants | West Indies | 18.1 /100 | #202 | Poor 84.5% |
| Canadians | 15.4 /100 | #203 | Poor 84.4% |
| Ecuadorians | 14.2 /100 | #204 | Poor 84.4% |
| French | 13.8 /100 | #205 | Poor 84.4% |
| Lebanese | 10.6 /100 | #206 | Poor 84.4% |
| Bangladeshis | 9.4 /100 | #207 | Tragic 84.3% |
| Arabs | 8.9 /100 | #208 | Tragic 84.3% |
Demographics Similar to Belizeans by In Labor Force | Age 30-34
In terms of in labor force | age 30-34, the demographic groups most similar to Belizeans are Guamanian/Chamorro (83.5%, a difference of 0.010%), Immigrants from Grenada (83.5%, a difference of 0.010%), Tongan (83.5%, a difference of 0.020%), Delaware (83.5%, a difference of 0.030%), and Spanish (83.5%, a difference of 0.060%).
| Demographics | Rating | Rank | In Labor Force | Age 30-34 |
| Spaniards | 0.1 /100 | #267 | Tragic 83.6% |
| Immigrants | Bangladesh | 0.1 /100 | #268 | Tragic 83.6% |
| Vietnamese | 0.1 /100 | #269 | Tragic 83.6% |
| Spanish Americans | 0.0 /100 | #270 | Tragic 83.5% |
| Spanish | 0.0 /100 | #271 | Tragic 83.5% |
| Immigrants | Nonimmigrants | 0.0 /100 | #272 | Tragic 83.5% |
| Guamanians/Chamorros | 0.0 /100 | #273 | Tragic 83.5% |
| Belizeans | 0.0 /100 | #274 | Tragic 83.5% |
| Immigrants | Grenada | 0.0 /100 | #275 | Tragic 83.5% |
| Tongans | 0.0 /100 | #276 | Tragic 83.5% |
| Delaware | 0.0 /100 | #277 | Tragic 83.5% |
| Fijians | 0.0 /100 | #278 | Tragic 83.4% |
| Immigrants | Fiji | 0.0 /100 | #279 | Tragic 83.4% |
| Africans | 0.0 /100 | #280 | Tragic 83.4% |
| Samoans | 0.0 /100 | #281 | Tragic 83.3% |