Tongan vs South American In Labor Force | Age 20-24
COMPARE
Tongan
South American
In Labor Force | Age 20-24
In Labor Force | Age 20-24 Comparison
Tongans
South Americans
77.9%
IN LABOR FORCE | AGE 20-24
100.0/ 100
METRIC RATING
26th/ 347
METRIC RANK
73.5%
IN LABOR FORCE | AGE 20-24
0.4/ 100
METRIC RATING
268th/ 347
METRIC RANK
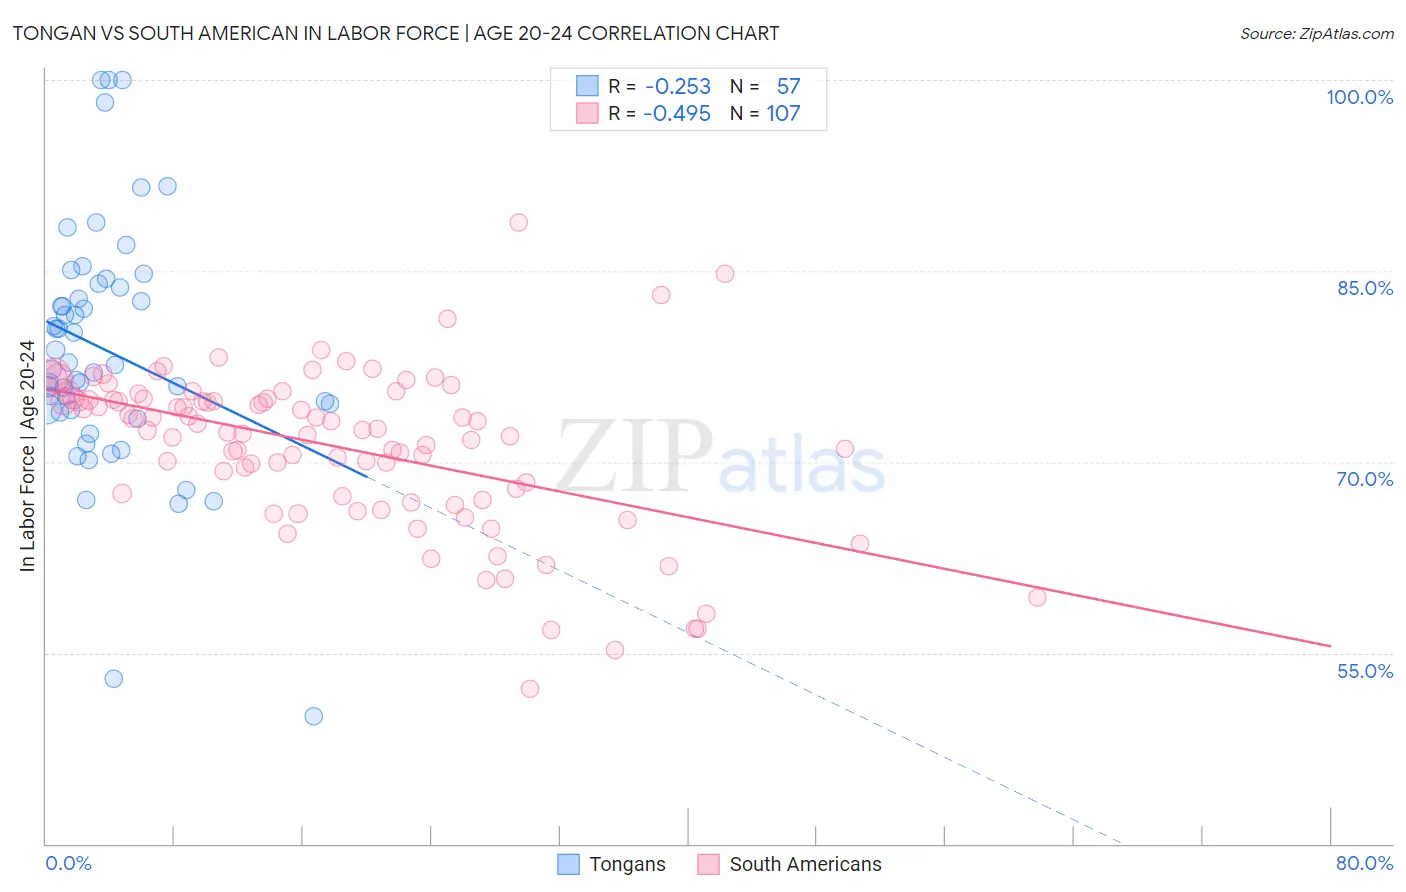
Tongan vs South American In Labor Force | Age 20-24 Correlation Chart
The statistical analysis conducted on geographies consisting of 102,904,168 people shows a weak negative correlation between the proportion of Tongans and labor force participation rate among population between the ages 20 and 24 in the United States with a correlation coefficient (R) of -0.253 and weighted average of 77.9%. Similarly, the statistical analysis conducted on geographies consisting of 493,868,145 people shows a moderate negative correlation between the proportion of South Americans and labor force participation rate among population between the ages 20 and 24 in the United States with a correlation coefficient (R) of -0.495 and weighted average of 73.5%, a difference of 6.0%.
In Labor Force | Age 20-24 Correlation Summary
| Measurement | Tongan | South American |
| Minimum | 50.0% | 52.2% |
| Maximum | 100.0% | 88.8% |
| Range | 50.0% | 36.6% |
| Mean | 78.7% | 71.2% |
| Median | 77.6% | 72.5% |
| Interquartile 25% (IQ1) | 74.0% | 67.3% |
| Interquartile 75% (IQ3) | 83.8% | 75.0% |
| Interquartile Range (IQR) | 9.8% | 7.7% |
| Standard Deviation (Sample) | 9.7% | 6.3% |
| Standard Deviation (Population) | 9.6% | 6.3% |
Similar Demographics by In Labor Force | Age 20-24
Demographics Similar to Tongans by In Labor Force | Age 20-24
In terms of in labor force | age 20-24, the demographic groups most similar to Tongans are Tlingit-Haida (77.9%, a difference of 0.020%), Yugoslavian (78.0%, a difference of 0.060%), Liberian (78.0%, a difference of 0.060%), Pennsylvania German (78.0%, a difference of 0.070%), and Immigrants from Micronesia (77.8%, a difference of 0.12%).
| Demographics | Rating | Rank | In Labor Force | Age 20-24 |
| Bangladeshis | 100.0 /100 | #19 | Exceptional 78.1% |
| French Canadians | 100.0 /100 | #20 | Exceptional 78.1% |
| Puget Sound Salish | 100.0 /100 | #21 | Exceptional 78.0% |
| Pennsylvania Germans | 100.0 /100 | #22 | Exceptional 78.0% |
| Yugoslavians | 100.0 /100 | #23 | Exceptional 78.0% |
| Liberians | 100.0 /100 | #24 | Exceptional 78.0% |
| Tlingit-Haida | 100.0 /100 | #25 | Exceptional 77.9% |
| Tongans | 100.0 /100 | #26 | Exceptional 77.9% |
| Immigrants | Micronesia | 100.0 /100 | #27 | Exceptional 77.8% |
| Belgians | 100.0 /100 | #28 | Exceptional 77.8% |
| Slovaks | 100.0 /100 | #29 | Exceptional 77.7% |
| Swiss | 100.0 /100 | #30 | Exceptional 77.7% |
| Poles | 100.0 /100 | #31 | Exceptional 77.6% |
| English | 100.0 /100 | #32 | Exceptional 77.6% |
| Immigrants | Ethiopia | 100.0 /100 | #33 | Exceptional 77.5% |
Demographics Similar to South Americans by In Labor Force | Age 20-24
In terms of in labor force | age 20-24, the demographic groups most similar to South Americans are Colombian (73.5%, a difference of 0.030%), Immigrants from Western Asia (73.5%, a difference of 0.050%), Immigrants from Russia (73.5%, a difference of 0.060%), Burmese (73.6%, a difference of 0.090%), and Haitian (73.6%, a difference of 0.090%).
| Demographics | Rating | Rank | In Labor Force | Age 20-24 |
| Houma | 0.6 /100 | #261 | Tragic 73.7% |
| Asians | 0.6 /100 | #262 | Tragic 73.7% |
| Immigrants | Asia | 0.5 /100 | #263 | Tragic 73.6% |
| Immigrants | Haiti | 0.5 /100 | #264 | Tragic 73.6% |
| Burmese | 0.5 /100 | #265 | Tragic 73.6% |
| Haitians | 0.5 /100 | #266 | Tragic 73.6% |
| Immigrants | Western Asia | 0.4 /100 | #267 | Tragic 73.5% |
| South Americans | 0.4 /100 | #268 | Tragic 73.5% |
| Colombians | 0.3 /100 | #269 | Tragic 73.5% |
| Immigrants | Russia | 0.3 /100 | #270 | Tragic 73.5% |
| Immigrants | Indonesia | 0.3 /100 | #271 | Tragic 73.4% |
| Belizeans | 0.3 /100 | #272 | Tragic 73.4% |
| Cheyenne | 0.2 /100 | #273 | Tragic 73.4% |
| Immigrants | Colombia | 0.2 /100 | #274 | Tragic 73.4% |
| Immigrants | South America | 0.2 /100 | #275 | Tragic 73.3% |