Tongan vs Palestinian In Labor Force | Age 20-24
COMPARE
Tongan
Palestinian
In Labor Force | Age 20-24
In Labor Force | Age 20-24 Comparison
Tongans
Palestinians
77.9%
IN LABOR FORCE | AGE 20-24
100.0/ 100
METRIC RATING
26th/ 347
METRIC RANK
75.6%
IN LABOR FORCE | AGE 20-24
88.4/ 100
METRIC RATING
132nd/ 347
METRIC RANK
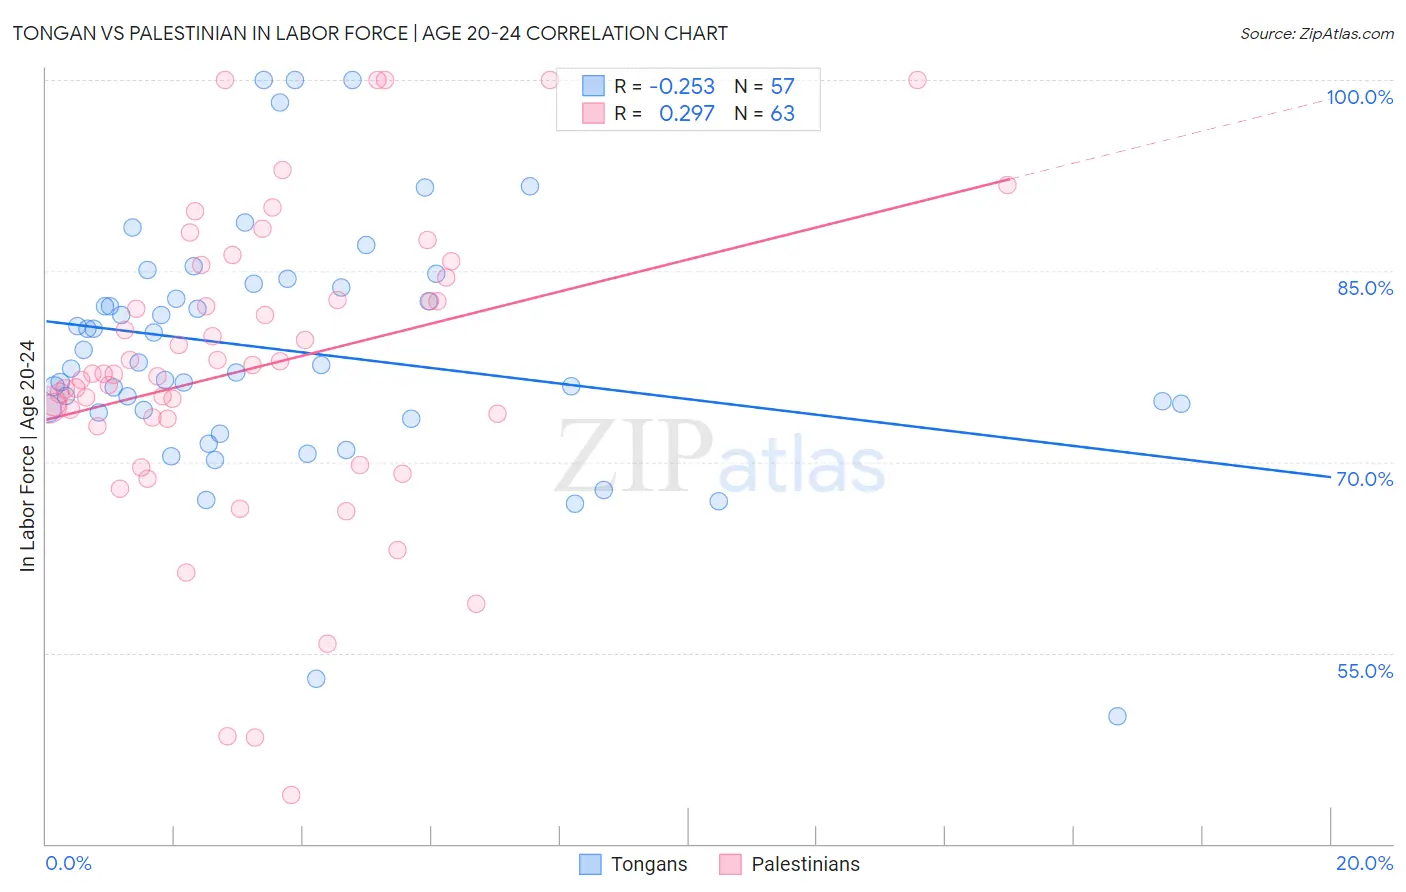
Tongan vs Palestinian In Labor Force | Age 20-24 Correlation Chart
The statistical analysis conducted on geographies consisting of 102,904,168 people shows a weak negative correlation between the proportion of Tongans and labor force participation rate among population between the ages 20 and 24 in the United States with a correlation coefficient (R) of -0.253 and weighted average of 77.9%. Similarly, the statistical analysis conducted on geographies consisting of 216,454,199 people shows a weak positive correlation between the proportion of Palestinians and labor force participation rate among population between the ages 20 and 24 in the United States with a correlation coefficient (R) of 0.297 and weighted average of 75.6%, a difference of 3.0%.
In Labor Force | Age 20-24 Correlation Summary
| Measurement | Tongan | Palestinian |
| Minimum | 50.0% | 43.8% |
| Maximum | 100.0% | 100.0% |
| Range | 50.0% | 56.2% |
| Mean | 78.7% | 77.5% |
| Median | 77.6% | 76.9% |
| Interquartile 25% (IQ1) | 74.0% | 73.4% |
| Interquartile 75% (IQ3) | 83.8% | 84.5% |
| Interquartile Range (IQR) | 9.8% | 11.1% |
| Standard Deviation (Sample) | 9.7% | 12.0% |
| Standard Deviation (Population) | 9.6% | 11.9% |
Similar Demographics by In Labor Force | Age 20-24
Demographics Similar to Tongans by In Labor Force | Age 20-24
In terms of in labor force | age 20-24, the demographic groups most similar to Tongans are Tlingit-Haida (77.9%, a difference of 0.020%), Yugoslavian (78.0%, a difference of 0.060%), Liberian (78.0%, a difference of 0.060%), Pennsylvania German (78.0%, a difference of 0.070%), and Immigrants from Micronesia (77.8%, a difference of 0.12%).
| Demographics | Rating | Rank | In Labor Force | Age 20-24 |
| Bangladeshis | 100.0 /100 | #19 | Exceptional 78.1% |
| French Canadians | 100.0 /100 | #20 | Exceptional 78.1% |
| Puget Sound Salish | 100.0 /100 | #21 | Exceptional 78.0% |
| Pennsylvania Germans | 100.0 /100 | #22 | Exceptional 78.0% |
| Yugoslavians | 100.0 /100 | #23 | Exceptional 78.0% |
| Liberians | 100.0 /100 | #24 | Exceptional 78.0% |
| Tlingit-Haida | 100.0 /100 | #25 | Exceptional 77.9% |
| Tongans | 100.0 /100 | #26 | Exceptional 77.9% |
| Immigrants | Micronesia | 100.0 /100 | #27 | Exceptional 77.8% |
| Belgians | 100.0 /100 | #28 | Exceptional 77.8% |
| Slovaks | 100.0 /100 | #29 | Exceptional 77.7% |
| Swiss | 100.0 /100 | #30 | Exceptional 77.7% |
| Poles | 100.0 /100 | #31 | Exceptional 77.6% |
| English | 100.0 /100 | #32 | Exceptional 77.6% |
| Immigrants | Ethiopia | 100.0 /100 | #33 | Exceptional 77.5% |
Demographics Similar to Palestinians by In Labor Force | Age 20-24
In terms of in labor force | age 20-24, the demographic groups most similar to Palestinians are Immigrants from Jordan (75.6%, a difference of 0.0%), Immigrants from Austria (75.6%, a difference of 0.010%), Zimbabwean (75.6%, a difference of 0.010%), Iroquois (75.6%, a difference of 0.020%), and Immigrants from Afghanistan (75.6%, a difference of 0.040%).
| Demographics | Rating | Rank | In Labor Force | Age 20-24 |
| Immigrants | Scotland | 93.7 /100 | #125 | Exceptional 75.8% |
| Brazilians | 93.0 /100 | #126 | Exceptional 75.8% |
| Sub-Saharan Africans | 90.9 /100 | #127 | Exceptional 75.7% |
| Immigrants | Afghanistan | 89.4 /100 | #128 | Excellent 75.6% |
| Iroquois | 89.1 /100 | #129 | Excellent 75.6% |
| Immigrants | Austria | 88.8 /100 | #130 | Excellent 75.6% |
| Immigrants | Jordan | 88.5 /100 | #131 | Excellent 75.6% |
| Palestinians | 88.4 /100 | #132 | Excellent 75.6% |
| Zimbabweans | 88.2 /100 | #133 | Excellent 75.6% |
| Estonians | 87.1 /100 | #134 | Excellent 75.6% |
| Yaqui | 85.5 /100 | #135 | Excellent 75.5% |
| Immigrants | Brazil | 84.8 /100 | #136 | Excellent 75.5% |
| Jordanians | 84.8 /100 | #137 | Excellent 75.5% |
| Australians | 84.8 /100 | #138 | Excellent 75.5% |
| Immigrants | England | 84.6 /100 | #139 | Excellent 75.5% |