Immigrants from Ethiopia vs Immigrants from Lithuania In Labor Force | Age 35-44
COMPARE
Immigrants from Ethiopia
Immigrants from Lithuania
In Labor Force | Age 35-44
In Labor Force | Age 35-44 Comparison
Immigrants from Ethiopia
Immigrants from Lithuania
85.9%
IN LABOR FORCE | AGE 35-44
100.0/ 100
METRIC RATING
8th/ 347
METRIC RANK
85.4%
IN LABOR FORCE | AGE 35-44
99.9/ 100
METRIC RATING
27th/ 347
METRIC RANK
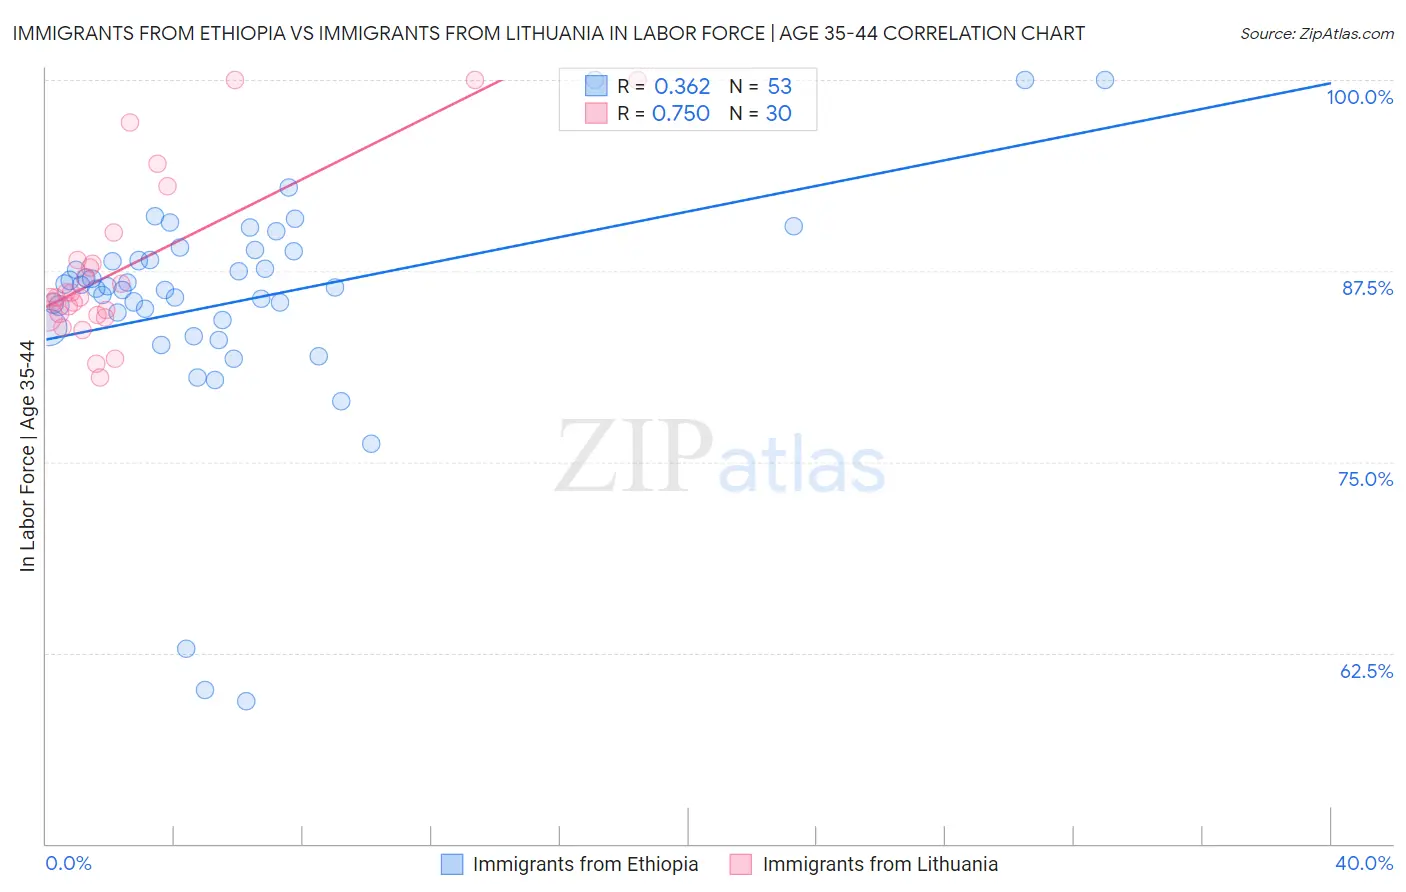
Immigrants from Ethiopia vs Immigrants from Lithuania In Labor Force | Age 35-44 Correlation Chart
The statistical analysis conducted on geographies consisting of 211,503,517 people shows a mild positive correlation between the proportion of Immigrants from Ethiopia and labor force participation rate among population between the ages 35 and 44 in the United States with a correlation coefficient (R) of 0.362 and weighted average of 85.9%. Similarly, the statistical analysis conducted on geographies consisting of 117,719,868 people shows a strong positive correlation between the proportion of Immigrants from Lithuania and labor force participation rate among population between the ages 35 and 44 in the United States with a correlation coefficient (R) of 0.750 and weighted average of 85.4%, a difference of 0.64%.
In Labor Force | Age 35-44 Correlation Summary
| Measurement | Immigrants from Ethiopia | Immigrants from Lithuania |
| Minimum | 59.3% | 80.5% |
| Maximum | 100.0% | 100.0% |
| Range | 40.7% | 19.5% |
| Mean | 85.5% | 87.7% |
| Median | 86.4% | 85.8% |
| Interquartile 25% (IQ1) | 84.1% | 84.7% |
| Interquartile 75% (IQ3) | 88.5% | 88.2% |
| Interquartile Range (IQR) | 4.4% | 3.6% |
| Standard Deviation (Sample) | 7.6% | 5.5% |
| Standard Deviation (Population) | 7.5% | 5.4% |
Demographics Similar to Immigrants from Ethiopia and Immigrants from Lithuania by In Labor Force | Age 35-44
In terms of in labor force | age 35-44, the demographic groups most similar to Immigrants from Ethiopia are Ethiopian (85.9%, a difference of 0.0%), Cape Verdean (85.8%, a difference of 0.13%), Immigrants from Cameroon (85.8%, a difference of 0.16%), Immigrants from Sierra Leone (86.1%, a difference of 0.17%), and Liberian (85.7%, a difference of 0.29%). Similarly, the demographic groups most similar to Immigrants from Lithuania are Paraguayan (85.4%, a difference of 0.0%), Immigrants from Liberia (85.4%, a difference of 0.0%), Latvian (85.4%, a difference of 0.020%), Immigrants from Eastern Africa (85.4%, a difference of 0.070%), and Immigrants from Bosnia and Herzegovina (85.4%, a difference of 0.10%).
| Demographics | Rating | Rank | In Labor Force | Age 35-44 |
| Immigrants | Sierra Leone | 100.0 /100 | #7 | Exceptional 86.1% |
| Immigrants | Ethiopia | 100.0 /100 | #8 | Exceptional 85.9% |
| Ethiopians | 100.0 /100 | #9 | Exceptional 85.9% |
| Cape Verdeans | 100.0 /100 | #10 | Exceptional 85.8% |
| Immigrants | Cameroon | 100.0 /100 | #11 | Exceptional 85.8% |
| Liberians | 100.0 /100 | #12 | Exceptional 85.7% |
| Somalis | 100.0 /100 | #13 | Exceptional 85.6% |
| Immigrants | Somalia | 100.0 /100 | #14 | Exceptional 85.6% |
| Norwegians | 100.0 /100 | #15 | Exceptional 85.6% |
| Immigrants | Ireland | 100.0 /100 | #16 | Exceptional 85.6% |
| Immigrants | North Macedonia | 100.0 /100 | #17 | Exceptional 85.6% |
| Carpatho Rusyns | 100.0 /100 | #18 | Exceptional 85.6% |
| Slovenes | 100.0 /100 | #19 | Exceptional 85.6% |
| Immigrants | Serbia | 100.0 /100 | #20 | Exceptional 85.5% |
| Bulgarians | 100.0 /100 | #21 | Exceptional 85.5% |
| Immigrants | Bosnia and Herzegovina | 100.0 /100 | #22 | Exceptional 85.4% |
| Immigrants | Eastern Africa | 100.0 /100 | #23 | Exceptional 85.4% |
| Latvians | 99.9 /100 | #24 | Exceptional 85.4% |
| Paraguayans | 99.9 /100 | #25 | Exceptional 85.4% |
| Immigrants | Liberia | 99.9 /100 | #26 | Exceptional 85.4% |
| Immigrants | Lithuania | 99.9 /100 | #27 | Exceptional 85.4% |