Tlingit-Haida vs Native Hawaiian Unemployment Among Ages 55 to 59 years
COMPARE
Tlingit-Haida
Native Hawaiian
Unemployment Among Ages 55 to 59 years
Unemployment Among Ages 55 to 59 years Comparison
Tlingit-Haida
Native Hawaiians
5.7%
UNEMPLOYMENT AMONG AGES 55 TO 59 YEARS
0.0/ 100
METRIC RATING
314th/ 347
METRIC RANK
5.1%
UNEMPLOYMENT AMONG AGES 55 TO 59 YEARS
0.5/ 100
METRIC RATING
248th/ 347
METRIC RANK
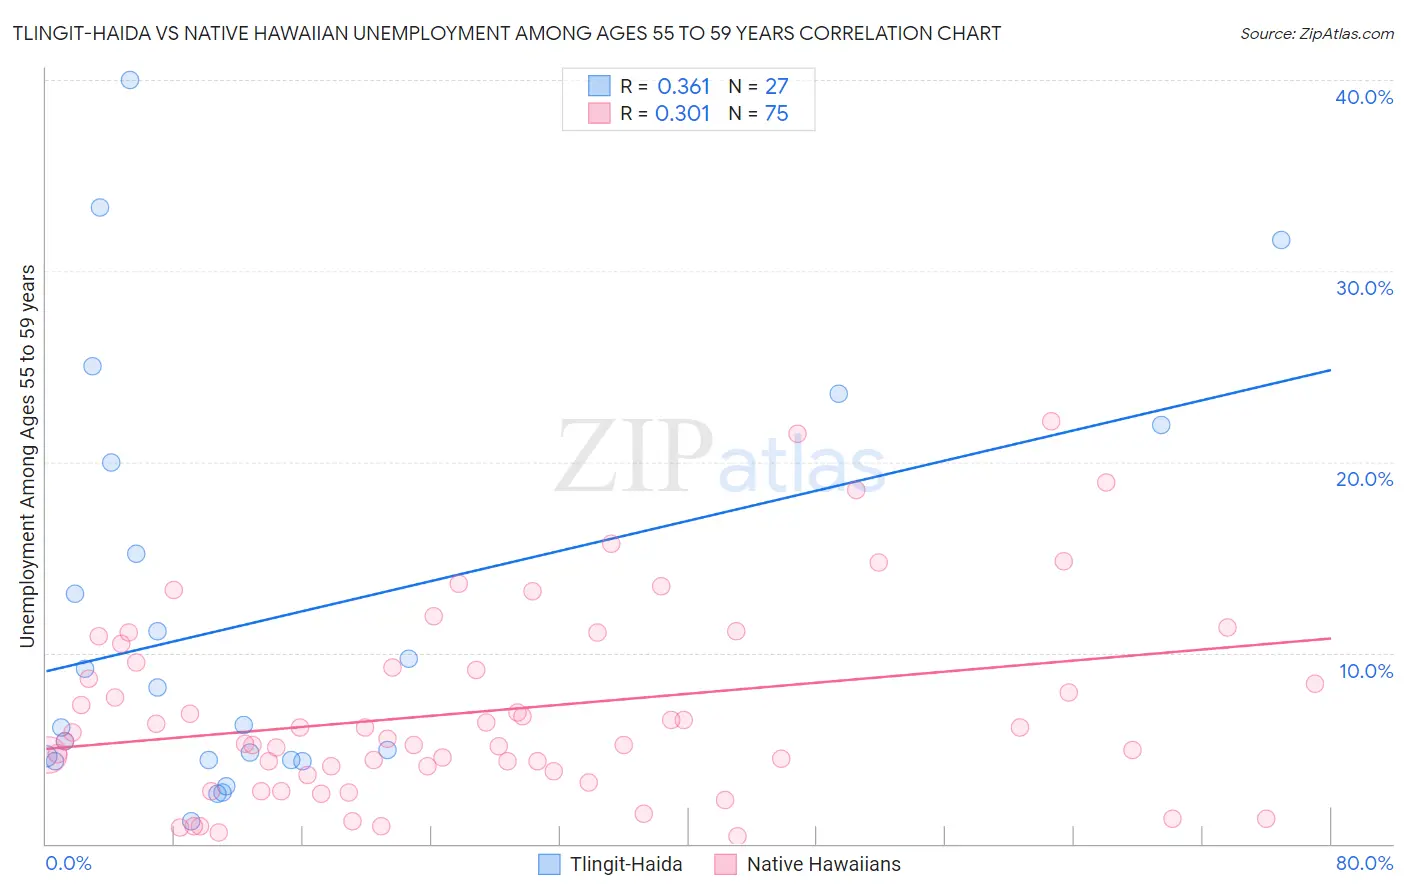
Tlingit-Haida vs Native Hawaiian Unemployment Among Ages 55 to 59 years Correlation Chart
The statistical analysis conducted on geographies consisting of 58,839,053 people shows a mild positive correlation between the proportion of Tlingit-Haida and unemployment rate among population between the ages 55 and 59 in the United States with a correlation coefficient (R) of 0.361 and weighted average of 5.7%. Similarly, the statistical analysis conducted on geographies consisting of 311,037,033 people shows a mild positive correlation between the proportion of Native Hawaiians and unemployment rate among population between the ages 55 and 59 in the United States with a correlation coefficient (R) of 0.301 and weighted average of 5.1%, a difference of 11.4%.
Unemployment Among Ages 55 to 59 years Correlation Summary
| Measurement | Tlingit-Haida | Native Hawaiian |
| Minimum | 1.2% | 0.40% |
| Maximum | 40.0% | 22.1% |
| Range | 38.8% | 21.7% |
| Mean | 11.9% | 7.0% |
| Median | 6.2% | 5.5% |
| Interquartile 25% (IQ1) | 4.4% | 3.8% |
| Interquartile 75% (IQ3) | 20.0% | 9.5% |
| Interquartile Range (IQR) | 15.6% | 5.7% |
| Standard Deviation (Sample) | 10.7% | 5.0% |
| Standard Deviation (Population) | 10.5% | 4.9% |
Similar Demographics by Unemployment Among Ages 55 to 59 years
Demographics Similar to Tlingit-Haida by Unemployment Among Ages 55 to 59 years
In terms of unemployment among ages 55 to 59 years, the demographic groups most similar to Tlingit-Haida are Guyanese (5.7%, a difference of 0.15%), Central American Indian (5.6%, a difference of 0.29%), Immigrants from Ecuador (5.7%, a difference of 0.34%), Ecuadorian (5.6%, a difference of 0.48%), and Hmong (5.7%, a difference of 0.57%).
| Demographics | Rating | Rank | Unemployment Among Ages 55 to 59 years |
| Immigrants | Belize | 0.0 /100 | #307 | Tragic 5.5% |
| Spanish American Indians | 0.0 /100 | #308 | Tragic 5.6% |
| Nepalese | 0.0 /100 | #309 | Tragic 5.6% |
| Belizeans | 0.0 /100 | #310 | Tragic 5.6% |
| Houma | 0.0 /100 | #311 | Tragic 5.6% |
| Ecuadorians | 0.0 /100 | #312 | Tragic 5.6% |
| Central American Indians | 0.0 /100 | #313 | Tragic 5.6% |
| Tlingit-Haida | 0.0 /100 | #314 | Tragic 5.7% |
| Guyanese | 0.0 /100 | #315 | Tragic 5.7% |
| Immigrants | Ecuador | 0.0 /100 | #316 | Tragic 5.7% |
| Hmong | 0.0 /100 | #317 | Tragic 5.7% |
| Immigrants | Guyana | 0.0 /100 | #318 | Tragic 5.8% |
| Kiowa | 0.0 /100 | #319 | Tragic 5.8% |
| Immigrants | Azores | 0.0 /100 | #320 | Tragic 5.8% |
| Chippewa | 0.0 /100 | #321 | Tragic 5.9% |
Demographics Similar to Native Hawaiians by Unemployment Among Ages 55 to 59 years
In terms of unemployment among ages 55 to 59 years, the demographic groups most similar to Native Hawaiians are Comanche (5.1%, a difference of 0.030%), Immigrants from Honduras (5.1%, a difference of 0.17%), Immigrants from Greece (5.1%, a difference of 0.18%), Soviet Union (5.1%, a difference of 0.20%), and Cheyenne (5.1%, a difference of 0.21%).
| Demographics | Rating | Rank | Unemployment Among Ages 55 to 59 years |
| Brazilians | 1.0 /100 | #241 | Tragic 5.0% |
| Liberians | 0.9 /100 | #242 | Tragic 5.1% |
| Hondurans | 0.7 /100 | #243 | Tragic 5.1% |
| Immigrants | Fiji | 0.7 /100 | #244 | Tragic 5.1% |
| Soviet Union | 0.6 /100 | #245 | Tragic 5.1% |
| Immigrants | Greece | 0.6 /100 | #246 | Tragic 5.1% |
| Immigrants | Honduras | 0.5 /100 | #247 | Tragic 5.1% |
| Native Hawaiians | 0.5 /100 | #248 | Tragic 5.1% |
| Comanche | 0.4 /100 | #249 | Tragic 5.1% |
| Cheyenne | 0.4 /100 | #250 | Tragic 5.1% |
| Portuguese | 0.3 /100 | #251 | Tragic 5.1% |
| U.S. Virgin Islanders | 0.3 /100 | #252 | Tragic 5.1% |
| Paraguayans | 0.3 /100 | #253 | Tragic 5.1% |
| Seminole | 0.3 /100 | #254 | Tragic 5.1% |
| Blackfeet | 0.3 /100 | #255 | Tragic 5.1% |