Brazilian vs Immigrants from Uganda In Labor Force | Age 16-19
COMPARE
Brazilian
Immigrants from Uganda
In Labor Force | Age 16-19
In Labor Force | Age 16-19 Comparison
Brazilians
Immigrants from Uganda
37.5%
IN LABOR FORCE | AGE 16-19
88.7/ 100
METRIC RATING
147th/ 347
METRIC RANK
39.2%
IN LABOR FORCE | AGE 16-19
99.7/ 100
METRIC RATING
84th/ 347
METRIC RANK
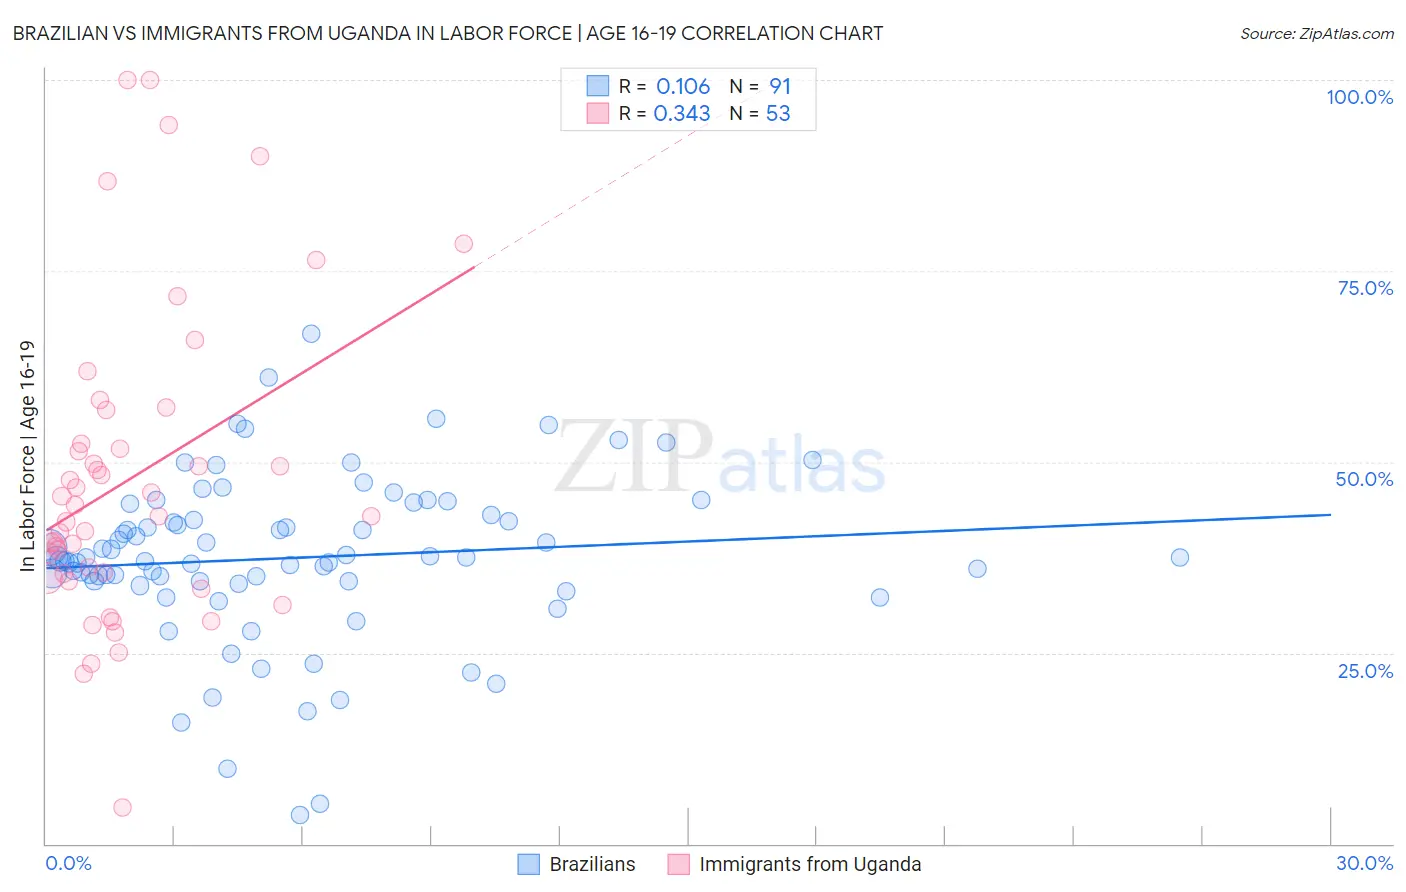
Brazilian vs Immigrants from Uganda In Labor Force | Age 16-19 Correlation Chart
The statistical analysis conducted on geographies consisting of 323,588,239 people shows a poor positive correlation between the proportion of Brazilians and labor force participation rate among population between the ages 16 and 19 in the United States with a correlation coefficient (R) of 0.106 and weighted average of 37.5%. Similarly, the statistical analysis conducted on geographies consisting of 125,968,157 people shows a mild positive correlation between the proportion of Immigrants from Uganda and labor force participation rate among population between the ages 16 and 19 in the United States with a correlation coefficient (R) of 0.343 and weighted average of 39.2%, a difference of 4.5%.
In Labor Force | Age 16-19 Correlation Summary
| Measurement | Brazilian | Immigrants from Uganda |
| Minimum | 3.7% | 4.7% |
| Maximum | 66.7% | 100.0% |
| Range | 63.0% | 95.3% |
| Mean | 37.4% | 47.8% |
| Median | 37.4% | 42.9% |
| Interquartile 25% (IQ1) | 34.3% | 35.0% |
| Interquartile 75% (IQ3) | 43.0% | 54.6% |
| Interquartile Range (IQR) | 8.7% | 19.6% |
| Standard Deviation (Sample) | 10.9% | 20.3% |
| Standard Deviation (Population) | 10.8% | 20.1% |
Similar Demographics by In Labor Force | Age 16-19
Demographics Similar to Brazilians by In Labor Force | Age 16-19
In terms of in labor force | age 16-19, the demographic groups most similar to Brazilians are Immigrants from Western Europe (37.5%, a difference of 0.030%), Japanese (37.5%, a difference of 0.080%), Paiute (37.5%, a difference of 0.080%), Pakistani (37.6%, a difference of 0.10%), and Sierra Leonean (37.6%, a difference of 0.13%).
| Demographics | Rating | Rank | In Labor Force | Age 16-19 |
| Estonians | 91.7 /100 | #140 | Exceptional 37.7% |
| Syrians | 90.7 /100 | #141 | Exceptional 37.6% |
| Sierra Leoneans | 89.7 /100 | #142 | Excellent 37.6% |
| Pakistanis | 89.5 /100 | #143 | Excellent 37.6% |
| Japanese | 89.3 /100 | #144 | Excellent 37.5% |
| Paiute | 89.3 /100 | #145 | Excellent 37.5% |
| Immigrants | Western Europe | 88.9 /100 | #146 | Excellent 37.5% |
| Brazilians | 88.7 /100 | #147 | Excellent 37.5% |
| Romanians | 87.3 /100 | #148 | Excellent 37.5% |
| Native Hawaiians | 85.0 /100 | #149 | Excellent 37.4% |
| Tsimshian | 84.7 /100 | #150 | Excellent 37.4% |
| Immigrants | Poland | 84.4 /100 | #151 | Excellent 37.3% |
| Immigrants | Sierra Leone | 83.6 /100 | #152 | Excellent 37.3% |
| Arapaho | 81.8 /100 | #153 | Excellent 37.3% |
| Immigrants | Bulgaria | 81.6 /100 | #154 | Excellent 37.3% |
Demographics Similar to Immigrants from Uganda by In Labor Force | Age 16-19
In terms of in labor force | age 16-19, the demographic groups most similar to Immigrants from Uganda are Spanish (39.3%, a difference of 0.13%), Basque (39.3%, a difference of 0.15%), Creek (39.1%, a difference of 0.15%), Samoan (39.1%, a difference of 0.17%), and Shoshone (39.3%, a difference of 0.21%).
| Demographics | Rating | Rank | In Labor Force | Age 16-19 |
| Immigrants | Portugal | 99.9 /100 | #77 | Exceptional 39.7% |
| Austrians | 99.8 /100 | #78 | Exceptional 39.5% |
| Marshallese | 99.8 /100 | #79 | Exceptional 39.5% |
| Immigrants | Iraq | 99.8 /100 | #80 | Exceptional 39.4% |
| Shoshone | 99.7 /100 | #81 | Exceptional 39.3% |
| Basques | 99.7 /100 | #82 | Exceptional 39.3% |
| Spanish | 99.7 /100 | #83 | Exceptional 39.3% |
| Immigrants | Uganda | 99.7 /100 | #84 | Exceptional 39.2% |
| Creek | 99.6 /100 | #85 | Exceptional 39.1% |
| Samoans | 99.6 /100 | #86 | Exceptional 39.1% |
| Immigrants | Germany | 99.6 /100 | #87 | Exceptional 39.1% |
| Puget Sound Salish | 99.6 /100 | #88 | Exceptional 39.1% |
| Alaska Natives | 99.6 /100 | #89 | Exceptional 39.1% |
| Immigrants | Burma/Myanmar | 99.5 /100 | #90 | Exceptional 39.0% |
| Spanish Americans | 99.5 /100 | #91 | Exceptional 39.0% |