Thai vs Osage In Labor Force | Age 20-64
COMPARE
Thai
Osage
In Labor Force | Age 20-64
In Labor Force | Age 20-64 Comparison
Thais
Osage
80.9%
IN LABOR FORCE | AGE 20-64
100.0/ 100
METRIC RATING
20th/ 347
METRIC RANK
78.0%
IN LABOR FORCE | AGE 20-64
0.0/ 100
METRIC RATING
285th/ 347
METRIC RANK
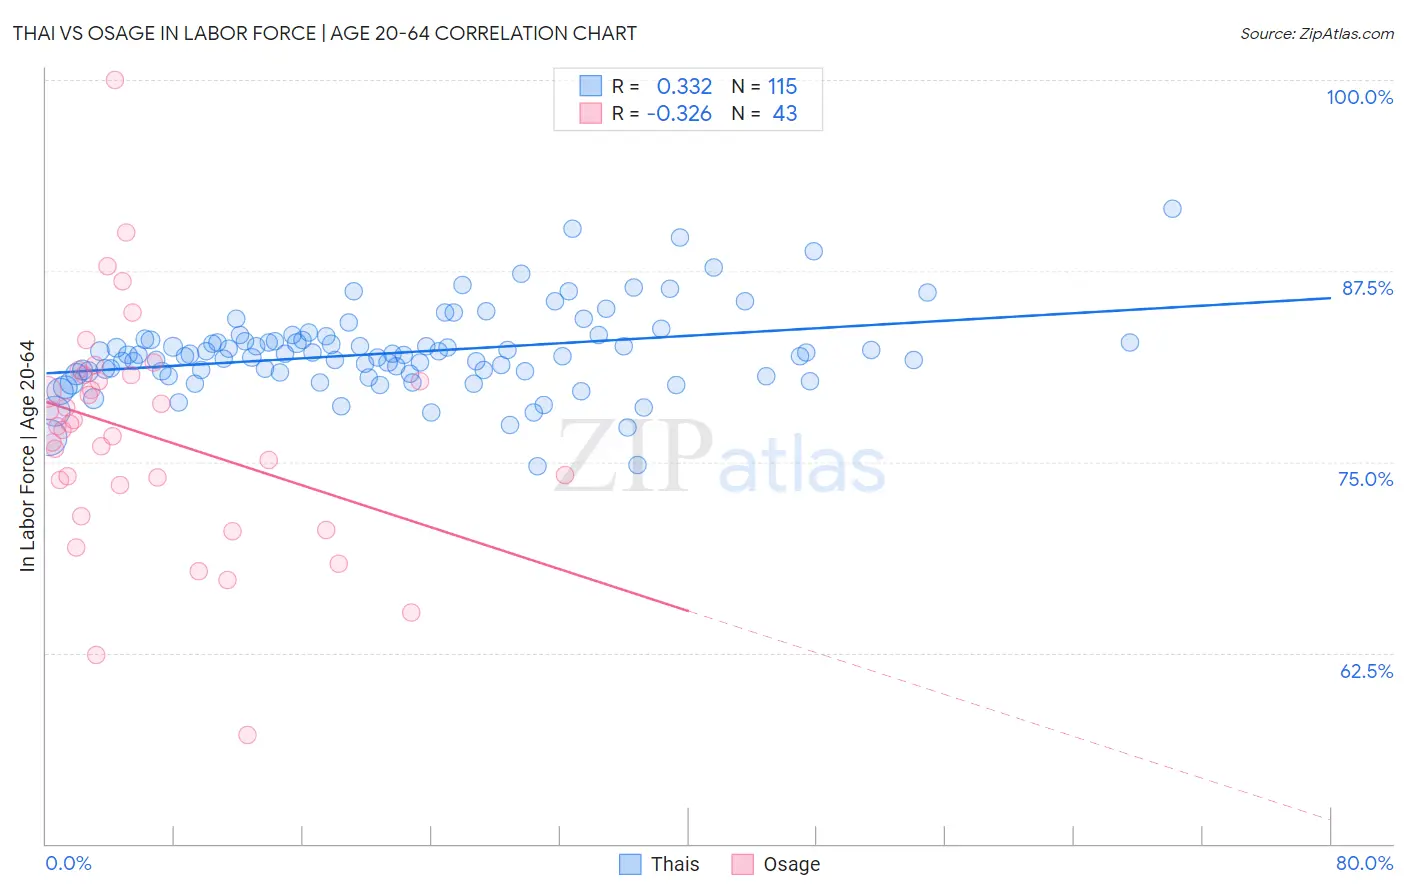
Thai vs Osage In Labor Force | Age 20-64 Correlation Chart
The statistical analysis conducted on geographies consisting of 475,903,874 people shows a mild positive correlation between the proportion of Thais and labor force participation rate among population between the ages 20 and 64 in the United States with a correlation coefficient (R) of 0.332 and weighted average of 80.9%. Similarly, the statistical analysis conducted on geographies consisting of 91,799,408 people shows a mild negative correlation between the proportion of Osage and labor force participation rate among population between the ages 20 and 64 in the United States with a correlation coefficient (R) of -0.326 and weighted average of 78.0%, a difference of 3.8%.
In Labor Force | Age 20-64 Correlation Summary
| Measurement | Thai | Osage |
| Minimum | 74.7% | 57.1% |
| Maximum | 91.6% | 100.0% |
| Range | 16.9% | 42.9% |
| Mean | 82.2% | 76.8% |
| Median | 82.0% | 77.4% |
| Interquartile 25% (IQ1) | 80.7% | 73.5% |
| Interquartile 75% (IQ3) | 83.0% | 80.7% |
| Interquartile Range (IQR) | 2.2% | 7.2% |
| Standard Deviation (Sample) | 2.8% | 7.5% |
| Standard Deviation (Population) | 2.7% | 7.4% |
Similar Demographics by In Labor Force | Age 20-64
Demographics Similar to Thais by In Labor Force | Age 20-64
In terms of in labor force | age 20-64, the demographic groups most similar to Thais are Liberian (80.9%, a difference of 0.020%), Zimbabwean (81.0%, a difference of 0.050%), Immigrants from Bulgaria (81.0%, a difference of 0.060%), Norwegian (81.0%, a difference of 0.070%), and Sudanese (80.8%, a difference of 0.090%).
| Demographics | Rating | Rank | In Labor Force | Age 20-64 |
| Immigrants | India | 100.0 /100 | #13 | Exceptional 81.3% |
| Cambodians | 100.0 /100 | #14 | Exceptional 81.1% |
| Bulgarians | 100.0 /100 | #15 | Exceptional 81.1% |
| Immigrants | Nepal | 100.0 /100 | #16 | Exceptional 81.1% |
| Norwegians | 100.0 /100 | #17 | Exceptional 81.0% |
| Immigrants | Bulgaria | 100.0 /100 | #18 | Exceptional 81.0% |
| Zimbabweans | 100.0 /100 | #19 | Exceptional 81.0% |
| Thais | 100.0 /100 | #20 | Exceptional 80.9% |
| Liberians | 100.0 /100 | #21 | Exceptional 80.9% |
| Sudanese | 100.0 /100 | #22 | Exceptional 80.8% |
| Immigrants | Bosnia and Herzegovina | 100.0 /100 | #23 | Exceptional 80.8% |
| Immigrants | Morocco | 100.0 /100 | #24 | Exceptional 80.8% |
| Kenyans | 100.0 /100 | #25 | Exceptional 80.8% |
| Immigrants | Serbia | 100.0 /100 | #26 | Exceptional 80.8% |
| Immigrants | Kenya | 99.9 /100 | #27 | Exceptional 80.7% |
Demographics Similar to Osage by In Labor Force | Age 20-64
In terms of in labor force | age 20-64, the demographic groups most similar to Osage are Immigrants from Belize (78.0%, a difference of 0.010%), Vietnamese (78.0%, a difference of 0.010%), Hmong (77.9%, a difference of 0.090%), Immigrants from Guyana (78.1%, a difference of 0.10%), and African (77.9%, a difference of 0.10%).
| Demographics | Rating | Rank | In Labor Force | Age 20-64 |
| Mexican American Indians | 0.0 /100 | #278 | Tragic 78.2% |
| Belizeans | 0.0 /100 | #279 | Tragic 78.2% |
| Immigrants | Dominica | 0.0 /100 | #280 | Tragic 78.1% |
| Guyanese | 0.0 /100 | #281 | Tragic 78.1% |
| Immigrants | St. Vincent and the Grenadines | 0.0 /100 | #282 | Tragic 78.1% |
| Immigrants | Nonimmigrants | 0.0 /100 | #283 | Tragic 78.1% |
| Immigrants | Guyana | 0.0 /100 | #284 | Tragic 78.1% |
| Osage | 0.0 /100 | #285 | Tragic 78.0% |
| Immigrants | Belize | 0.0 /100 | #286 | Tragic 78.0% |
| Vietnamese | 0.0 /100 | #287 | Tragic 78.0% |
| Hmong | 0.0 /100 | #288 | Tragic 77.9% |
| Africans | 0.0 /100 | #289 | Tragic 77.9% |
| Immigrants | Bangladesh | 0.0 /100 | #290 | Tragic 77.9% |
| Spanish Americans | 0.0 /100 | #291 | Tragic 77.8% |
| Immigrants | Azores | 0.0 /100 | #292 | Tragic 77.8% |