Thai vs Immigrants from Hong Kong In Labor Force | Age > 16
COMPARE
Thai
Immigrants from Hong Kong
In Labor Force | Age > 16
In Labor Force | Age > 16 Comparison
Thais
Immigrants from Hong Kong
67.2%
IN LABOR FORCE | AGE > 16
100.0/ 100
METRIC RATING
29th/ 347
METRIC RANK
65.7%
IN LABOR FORCE | AGE > 16
96.2/ 100
METRIC RATING
120th/ 347
METRIC RANK
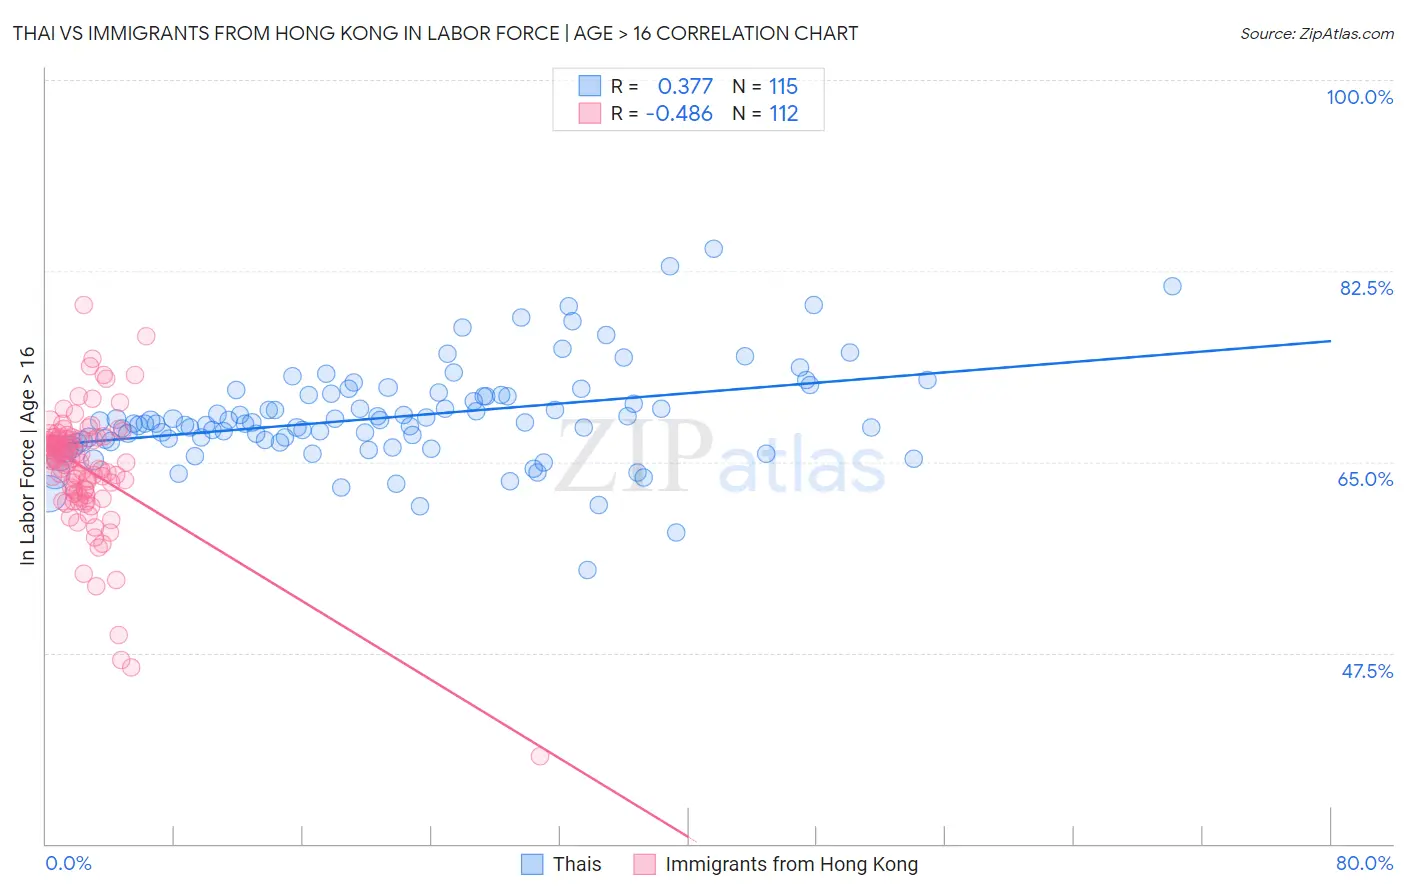
Thai vs Immigrants from Hong Kong In Labor Force | Age > 16 Correlation Chart
The statistical analysis conducted on geographies consisting of 475,904,842 people shows a mild positive correlation between the proportion of Thais and labor force participation rate among population ages 16 and over in the United States with a correlation coefficient (R) of 0.377 and weighted average of 67.2%. Similarly, the statistical analysis conducted on geographies consisting of 254,003,180 people shows a moderate negative correlation between the proportion of Immigrants from Hong Kong and labor force participation rate among population ages 16 and over in the United States with a correlation coefficient (R) of -0.486 and weighted average of 65.7%, a difference of 2.3%.
In Labor Force | Age > 16 Correlation Summary
| Measurement | Thai | Immigrants from Hong Kong |
| Minimum | 55.1% | 38.0% |
| Maximum | 84.5% | 79.4% |
| Range | 29.4% | 41.4% |
| Mean | 69.1% | 64.4% |
| Median | 68.5% | 65.4% |
| Interquartile 25% (IQ1) | 66.9% | 62.3% |
| Interquartile 75% (IQ3) | 71.2% | 67.1% |
| Interquartile Range (IQR) | 4.3% | 4.8% |
| Standard Deviation (Sample) | 4.6% | 5.7% |
| Standard Deviation (Population) | 4.5% | 5.6% |
Similar Demographics by In Labor Force | Age > 16
Demographics Similar to Thais by In Labor Force | Age > 16
In terms of in labor force | age > 16, the demographic groups most similar to Thais are Immigrants from Zaire (67.2%, a difference of 0.010%), Immigrants from Morocco (67.2%, a difference of 0.040%), Ghanaian (67.1%, a difference of 0.11%), Zimbabwean (67.3%, a difference of 0.12%), and Immigrants from Congo (67.1%, a difference of 0.16%).
| Demographics | Rating | Rank | In Labor Force | Age > 16 |
| Immigrants | Uganda | 100.0 /100 | #22 | Exceptional 67.5% |
| Cambodians | 100.0 /100 | #23 | Exceptional 67.4% |
| Ugandans | 100.0 /100 | #24 | Exceptional 67.4% |
| Immigrants | Africa | 100.0 /100 | #25 | Exceptional 67.4% |
| Immigrants | Cabo Verde | 100.0 /100 | #26 | Exceptional 67.3% |
| Zimbabweans | 100.0 /100 | #27 | Exceptional 67.3% |
| Immigrants | Morocco | 100.0 /100 | #28 | Exceptional 67.2% |
| Thais | 100.0 /100 | #29 | Exceptional 67.2% |
| Immigrants | Zaire | 100.0 /100 | #30 | Exceptional 67.2% |
| Ghanaians | 100.0 /100 | #31 | Exceptional 67.1% |
| Immigrants | Congo | 100.0 /100 | #32 | Exceptional 67.1% |
| Afghans | 100.0 /100 | #33 | Exceptional 67.1% |
| Immigrants | Ghana | 100.0 /100 | #34 | Exceptional 67.1% |
| Immigrants | South Central Asia | 100.0 /100 | #35 | Exceptional 67.1% |
| Immigrants | Western Africa | 100.0 /100 | #36 | Exceptional 67.1% |
Demographics Similar to Immigrants from Hong Kong by In Labor Force | Age > 16
In terms of in labor force | age > 16, the demographic groups most similar to Immigrants from Hong Kong are Immigrants from France (65.7%, a difference of 0.020%), New Zealander (65.7%, a difference of 0.020%), Immigrants from Ecuador (65.7%, a difference of 0.020%), Immigrants from Iran (65.7%, a difference of 0.030%), and Immigrants from Thailand (65.7%, a difference of 0.030%).
| Demographics | Rating | Rank | In Labor Force | Age > 16 |
| Pakistanis | 97.1 /100 | #113 | Exceptional 65.8% |
| Hondurans | 97.1 /100 | #114 | Exceptional 65.8% |
| Immigrants | Indonesia | 96.8 /100 | #115 | Exceptional 65.7% |
| Argentineans | 96.7 /100 | #116 | Exceptional 65.7% |
| Immigrants | Iran | 96.6 /100 | #117 | Exceptional 65.7% |
| Immigrants | Thailand | 96.6 /100 | #118 | Exceptional 65.7% |
| Immigrants | France | 96.4 /100 | #119 | Exceptional 65.7% |
| Immigrants | Hong Kong | 96.2 /100 | #120 | Exceptional 65.7% |
| New Zealanders | 96.0 /100 | #121 | Exceptional 65.7% |
| Immigrants | Ecuador | 95.9 /100 | #122 | Exceptional 65.7% |
| Immigrants | Iraq | 95.5 /100 | #123 | Exceptional 65.7% |
| Iraqis | 95.4 /100 | #124 | Exceptional 65.7% |
| Norwegians | 95.3 /100 | #125 | Exceptional 65.7% |
| Koreans | 95.3 /100 | #126 | Exceptional 65.7% |
| Immigrants | Eastern Asia | 94.9 /100 | #127 | Exceptional 65.7% |