Thai vs Immigrants from Morocco In Labor Force | Age > 16
COMPARE
Thai
Immigrants from Morocco
In Labor Force | Age > 16
In Labor Force | Age > 16 Comparison
Thais
Immigrants from Morocco
67.2%
IN LABOR FORCE | AGE > 16
100.0/ 100
METRIC RATING
29th/ 347
METRIC RANK
67.2%
IN LABOR FORCE | AGE > 16
100.0/ 100
METRIC RATING
28th/ 347
METRIC RANK
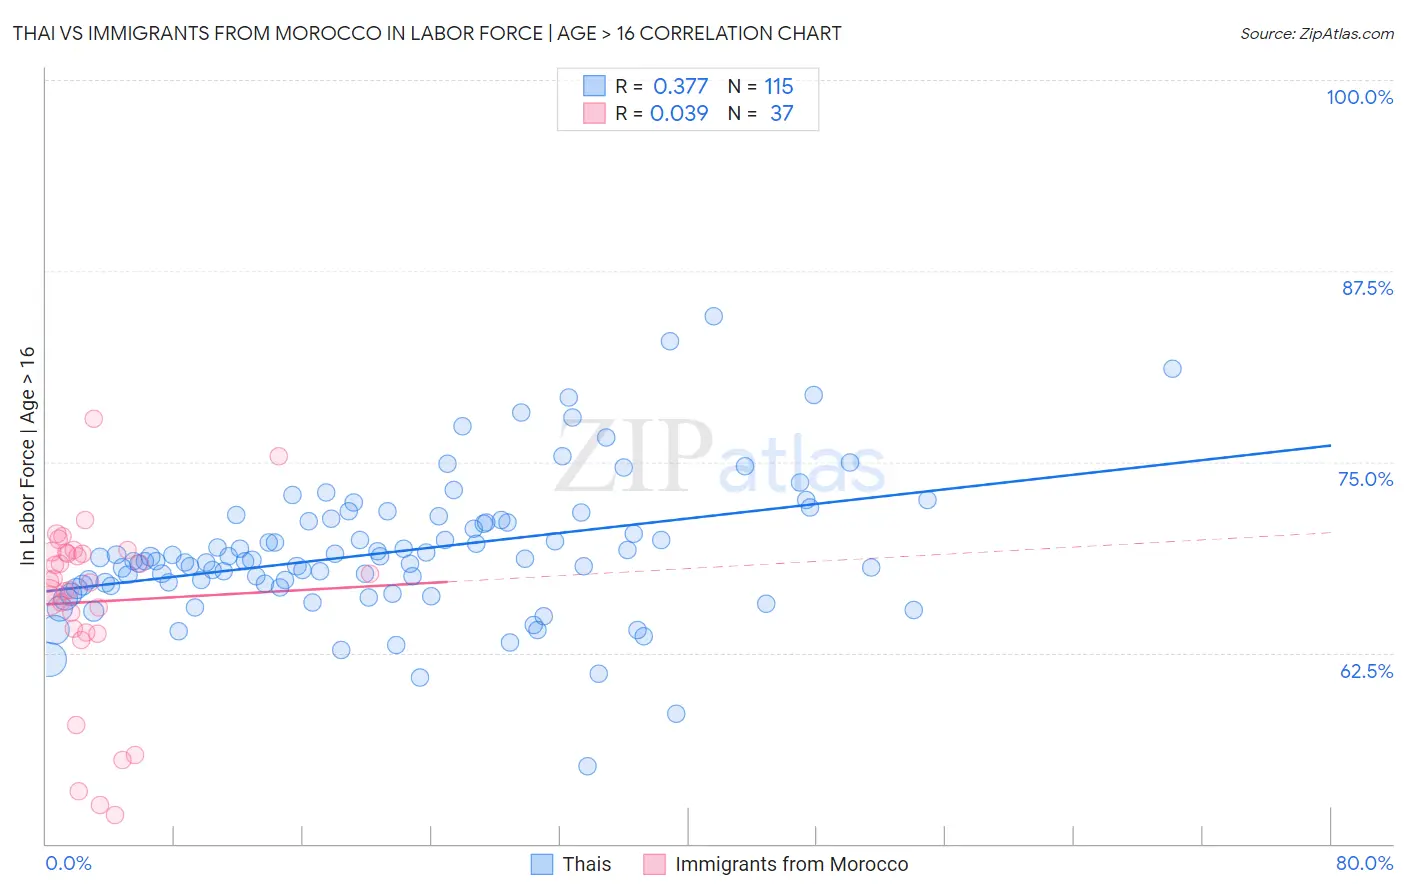
Thai vs Immigrants from Morocco In Labor Force | Age > 16 Correlation Chart
The statistical analysis conducted on geographies consisting of 475,904,842 people shows a mild positive correlation between the proportion of Thais and labor force participation rate among population ages 16 and over in the United States with a correlation coefficient (R) of 0.377 and weighted average of 67.2%. Similarly, the statistical analysis conducted on geographies consisting of 178,912,438 people shows no correlation between the proportion of Immigrants from Morocco and labor force participation rate among population ages 16 and over in the United States with a correlation coefficient (R) of 0.039 and weighted average of 67.2%, a difference of 0.040%.
In Labor Force | Age > 16 Correlation Summary
| Measurement | Thai | Immigrants from Morocco |
| Minimum | 55.1% | 51.9% |
| Maximum | 84.5% | 77.8% |
| Range | 29.4% | 25.9% |
| Mean | 69.1% | 65.8% |
| Median | 68.5% | 67.2% |
| Interquartile 25% (IQ1) | 66.9% | 63.9% |
| Interquartile 75% (IQ3) | 71.2% | 69.1% |
| Interquartile Range (IQR) | 4.3% | 5.2% |
| Standard Deviation (Sample) | 4.6% | 5.9% |
| Standard Deviation (Population) | 4.5% | 5.8% |
Demographics Similar to Thais and Immigrants from Morocco by In Labor Force | Age > 16
In terms of in labor force | age > 16, the demographic groups most similar to Thais are Immigrants from Zaire (67.2%, a difference of 0.010%), Ghanaian (67.1%, a difference of 0.11%), Zimbabwean (67.3%, a difference of 0.12%), Immigrants from Congo (67.1%, a difference of 0.16%), and Afghan (67.1%, a difference of 0.17%). Similarly, the demographic groups most similar to Immigrants from Morocco are Immigrants from Zaire (67.2%, a difference of 0.040%), Zimbabwean (67.3%, a difference of 0.080%), Ghanaian (67.1%, a difference of 0.14%), Immigrants from Cabo Verde (67.3%, a difference of 0.16%), and Immigrants from Africa (67.4%, a difference of 0.19%).
| Demographics | Rating | Rank | In Labor Force | Age > 16 |
| Immigrants | Liberia | 100.0 /100 | #18 | Exceptional 67.6% |
| Kenyans | 100.0 /100 | #19 | Exceptional 67.6% |
| Immigrants | Kenya | 100.0 /100 | #20 | Exceptional 67.6% |
| Tongans | 100.0 /100 | #21 | Exceptional 67.5% |
| Immigrants | Uganda | 100.0 /100 | #22 | Exceptional 67.5% |
| Cambodians | 100.0 /100 | #23 | Exceptional 67.4% |
| Ugandans | 100.0 /100 | #24 | Exceptional 67.4% |
| Immigrants | Africa | 100.0 /100 | #25 | Exceptional 67.4% |
| Immigrants | Cabo Verde | 100.0 /100 | #26 | Exceptional 67.3% |
| Zimbabweans | 100.0 /100 | #27 | Exceptional 67.3% |
| Immigrants | Morocco | 100.0 /100 | #28 | Exceptional 67.2% |
| Thais | 100.0 /100 | #29 | Exceptional 67.2% |
| Immigrants | Zaire | 100.0 /100 | #30 | Exceptional 67.2% |
| Ghanaians | 100.0 /100 | #31 | Exceptional 67.1% |
| Immigrants | Congo | 100.0 /100 | #32 | Exceptional 67.1% |
| Afghans | 100.0 /100 | #33 | Exceptional 67.1% |
| Immigrants | Ghana | 100.0 /100 | #34 | Exceptional 67.1% |
| Immigrants | South Central Asia | 100.0 /100 | #35 | Exceptional 67.1% |
| Immigrants | Western Africa | 100.0 /100 | #36 | Exceptional 67.1% |
| Immigrants | Afghanistan | 100.0 /100 | #37 | Exceptional 67.0% |
| Immigrants | Nigeria | 100.0 /100 | #38 | Exceptional 66.9% |