Thai vs Immigrants from Guyana In Labor Force | Age > 16
COMPARE
Thai
Immigrants from Guyana
In Labor Force | Age > 16
In Labor Force | Age > 16 Comparison
Thais
Immigrants from Guyana
67.2%
IN LABOR FORCE | AGE > 16
100.0/ 100
METRIC RATING
29th/ 347
METRIC RANK
64.0%
IN LABOR FORCE | AGE > 16
0.2/ 100
METRIC RATING
282nd/ 347
METRIC RANK
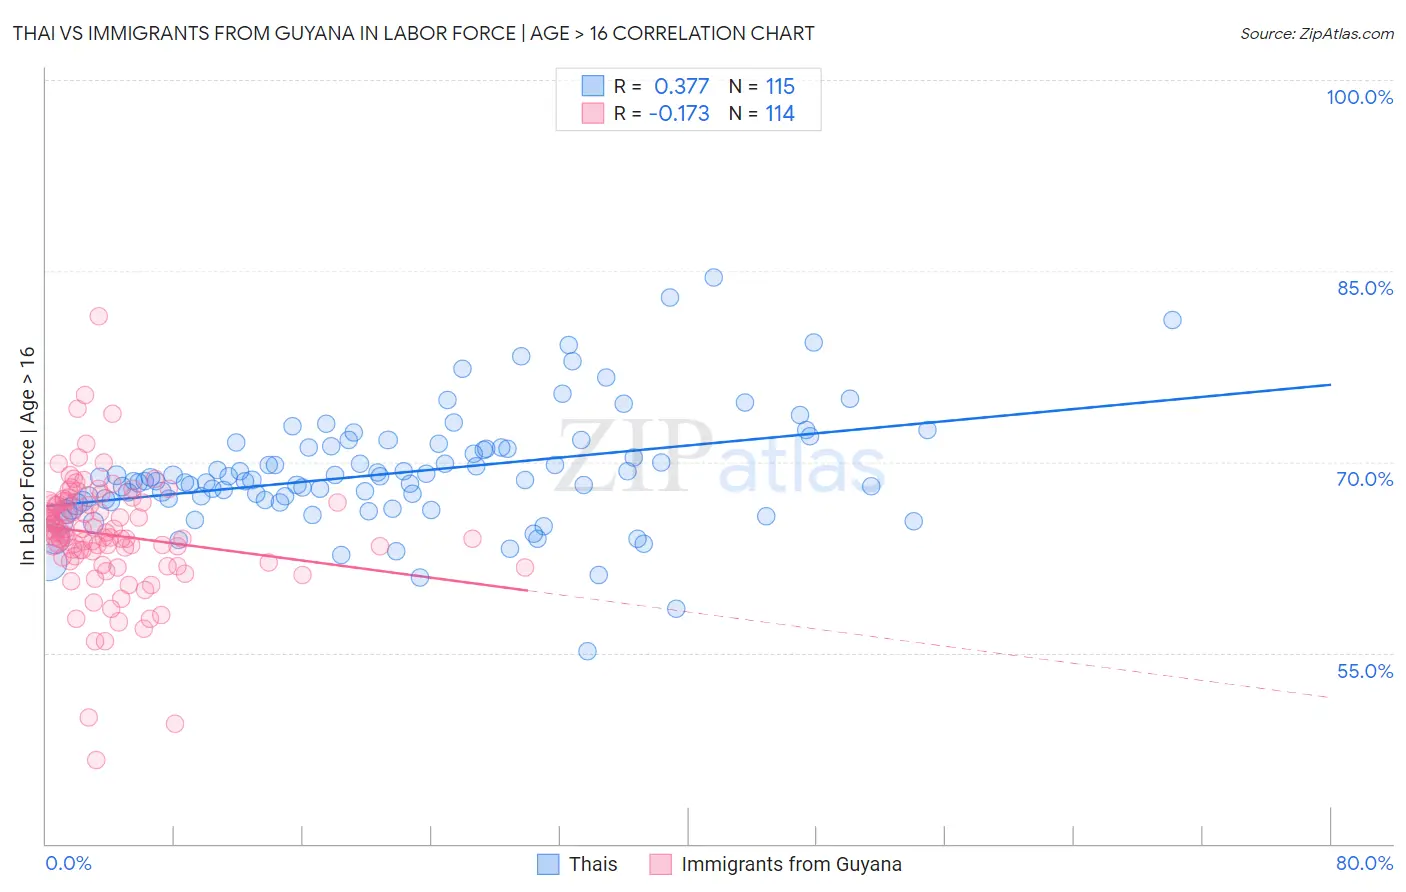
Thai vs Immigrants from Guyana In Labor Force | Age > 16 Correlation Chart
The statistical analysis conducted on geographies consisting of 475,904,842 people shows a mild positive correlation between the proportion of Thais and labor force participation rate among population ages 16 and over in the United States with a correlation coefficient (R) of 0.377 and weighted average of 67.2%. Similarly, the statistical analysis conducted on geographies consisting of 183,746,738 people shows a poor negative correlation between the proportion of Immigrants from Guyana and labor force participation rate among population ages 16 and over in the United States with a correlation coefficient (R) of -0.173 and weighted average of 64.0%, a difference of 5.1%.
In Labor Force | Age > 16 Correlation Summary
| Measurement | Thai | Immigrants from Guyana |
| Minimum | 55.1% | 46.6% |
| Maximum | 84.5% | 81.4% |
| Range | 29.4% | 34.8% |
| Mean | 69.1% | 64.3% |
| Median | 68.5% | 64.3% |
| Interquartile 25% (IQ1) | 66.9% | 62.5% |
| Interquartile 75% (IQ3) | 71.2% | 66.7% |
| Interquartile Range (IQR) | 4.3% | 4.2% |
| Standard Deviation (Sample) | 4.6% | 4.6% |
| Standard Deviation (Population) | 4.5% | 4.6% |
Similar Demographics by In Labor Force | Age > 16
Demographics Similar to Thais by In Labor Force | Age > 16
In terms of in labor force | age > 16, the demographic groups most similar to Thais are Immigrants from Zaire (67.2%, a difference of 0.010%), Immigrants from Morocco (67.2%, a difference of 0.040%), Ghanaian (67.1%, a difference of 0.11%), Zimbabwean (67.3%, a difference of 0.12%), and Immigrants from Congo (67.1%, a difference of 0.16%).
| Demographics | Rating | Rank | In Labor Force | Age > 16 |
| Immigrants | Uganda | 100.0 /100 | #22 | Exceptional 67.5% |
| Cambodians | 100.0 /100 | #23 | Exceptional 67.4% |
| Ugandans | 100.0 /100 | #24 | Exceptional 67.4% |
| Immigrants | Africa | 100.0 /100 | #25 | Exceptional 67.4% |
| Immigrants | Cabo Verde | 100.0 /100 | #26 | Exceptional 67.3% |
| Zimbabweans | 100.0 /100 | #27 | Exceptional 67.3% |
| Immigrants | Morocco | 100.0 /100 | #28 | Exceptional 67.2% |
| Thais | 100.0 /100 | #29 | Exceptional 67.2% |
| Immigrants | Zaire | 100.0 /100 | #30 | Exceptional 67.2% |
| Ghanaians | 100.0 /100 | #31 | Exceptional 67.1% |
| Immigrants | Congo | 100.0 /100 | #32 | Exceptional 67.1% |
| Afghans | 100.0 /100 | #33 | Exceptional 67.1% |
| Immigrants | Ghana | 100.0 /100 | #34 | Exceptional 67.1% |
| Immigrants | South Central Asia | 100.0 /100 | #35 | Exceptional 67.1% |
| Immigrants | Western Africa | 100.0 /100 | #36 | Exceptional 67.1% |
Demographics Similar to Immigrants from Guyana by In Labor Force | Age > 16
In terms of in labor force | age > 16, the demographic groups most similar to Immigrants from Guyana are Immigrants from Germany (63.9%, a difference of 0.040%), French (63.9%, a difference of 0.060%), Immigrants from St. Vincent and the Grenadines (64.0%, a difference of 0.080%), French Canadian (64.0%, a difference of 0.080%), and Welsh (64.0%, a difference of 0.090%).
| Demographics | Rating | Rank | In Labor Force | Age > 16 |
| Mexicans | 0.3 /100 | #275 | Tragic 64.1% |
| French American Indians | 0.3 /100 | #276 | Tragic 64.1% |
| Immigrants | Bahamas | 0.3 /100 | #277 | Tragic 64.0% |
| Assyrians/Chaldeans/Syriacs | 0.3 /100 | #278 | Tragic 64.0% |
| Welsh | 0.2 /100 | #279 | Tragic 64.0% |
| Immigrants | St. Vincent and the Grenadines | 0.2 /100 | #280 | Tragic 64.0% |
| French Canadians | 0.2 /100 | #281 | Tragic 64.0% |
| Immigrants | Guyana | 0.2 /100 | #282 | Tragic 64.0% |
| Immigrants | Germany | 0.1 /100 | #283 | Tragic 63.9% |
| French | 0.1 /100 | #284 | Tragic 63.9% |
| Slovaks | 0.1 /100 | #285 | Tragic 63.9% |
| Immigrants | Austria | 0.1 /100 | #286 | Tragic 63.9% |
| Scottish | 0.1 /100 | #287 | Tragic 63.9% |
| Spanish | 0.1 /100 | #288 | Tragic 63.9% |
| Celtics | 0.1 /100 | #289 | Tragic 63.8% |