Immigrants from Greece vs Immigrants from Hong Kong In Labor Force | Age > 16
COMPARE
Immigrants from Greece
Immigrants from Hong Kong
In Labor Force | Age > 16
In Labor Force | Age > 16 Comparison
Immigrants from Greece
Immigrants from Hong Kong
65.0%
IN LABOR FORCE | AGE > 16
34.3/ 100
METRIC RATING
189th/ 347
METRIC RANK
65.7%
IN LABOR FORCE | AGE > 16
96.2/ 100
METRIC RATING
120th/ 347
METRIC RANK
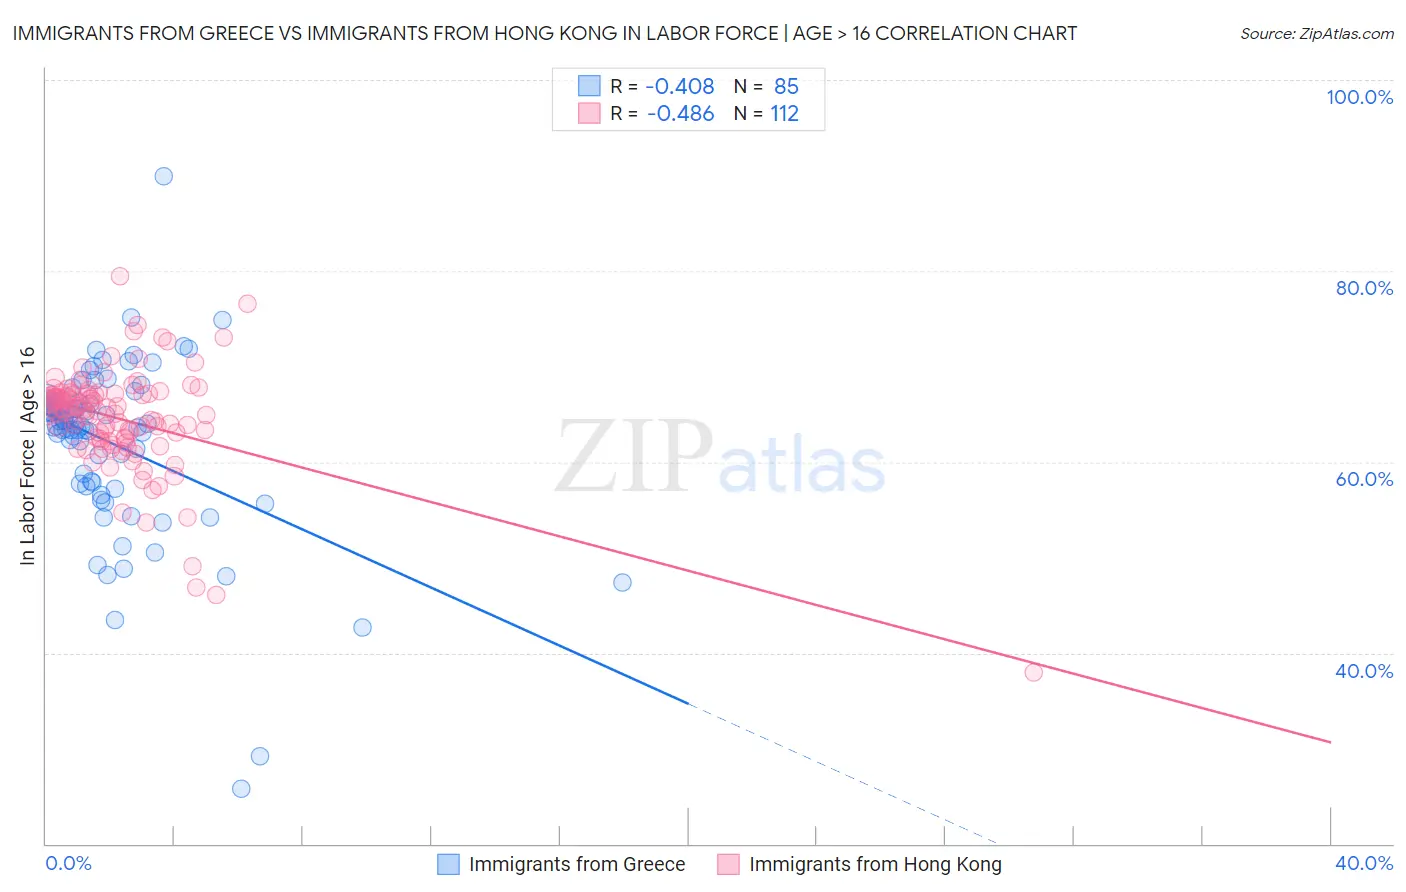
Immigrants from Greece vs Immigrants from Hong Kong In Labor Force | Age > 16 Correlation Chart
The statistical analysis conducted on geographies consisting of 216,877,956 people shows a moderate negative correlation between the proportion of Immigrants from Greece and labor force participation rate among population ages 16 and over in the United States with a correlation coefficient (R) of -0.408 and weighted average of 65.0%. Similarly, the statistical analysis conducted on geographies consisting of 254,003,180 people shows a moderate negative correlation between the proportion of Immigrants from Hong Kong and labor force participation rate among population ages 16 and over in the United States with a correlation coefficient (R) of -0.486 and weighted average of 65.7%, a difference of 1.1%.
In Labor Force | Age > 16 Correlation Summary
| Measurement | Immigrants from Greece | Immigrants from Hong Kong |
| Minimum | 25.8% | 38.0% |
| Maximum | 89.9% | 79.4% |
| Range | 64.1% | 41.4% |
| Mean | 61.8% | 64.4% |
| Median | 63.8% | 65.4% |
| Interquartile 25% (IQ1) | 57.6% | 62.3% |
| Interquartile 75% (IQ3) | 66.2% | 67.1% |
| Interquartile Range (IQR) | 8.6% | 4.8% |
| Standard Deviation (Sample) | 9.2% | 5.7% |
| Standard Deviation (Population) | 9.2% | 5.6% |
Similar Demographics by In Labor Force | Age > 16
Demographics Similar to Immigrants from Greece by In Labor Force | Age > 16
In terms of in labor force | age > 16, the demographic groups most similar to Immigrants from Greece are Barbadian (65.0%, a difference of 0.0%), Immigrants from Portugal (65.0%, a difference of 0.010%), Scandinavian (65.0%, a difference of 0.010%), Immigrants from Fiji (65.0%, a difference of 0.010%), and Immigrants from Europe (65.0%, a difference of 0.010%).
| Demographics | Rating | Rank | In Labor Force | Age > 16 |
| Immigrants | Nicaragua | 41.1 /100 | #182 | Average 65.1% |
| Soviet Union | 40.5 /100 | #183 | Average 65.0% |
| Carpatho Rusyns | 40.0 /100 | #184 | Average 65.0% |
| Syrians | 40.0 /100 | #185 | Average 65.0% |
| Immigrants | Switzerland | 38.2 /100 | #186 | Fair 65.0% |
| Immigrants | Croatia | 35.7 /100 | #187 | Fair 65.0% |
| Immigrants | Portugal | 34.8 /100 | #188 | Fair 65.0% |
| Immigrants | Greece | 34.3 /100 | #189 | Fair 65.0% |
| Barbadians | 33.9 /100 | #190 | Fair 65.0% |
| Scandinavians | 33.7 /100 | #191 | Fair 65.0% |
| Immigrants | Fiji | 33.7 /100 | #192 | Fair 65.0% |
| Immigrants | Europe | 33.6 /100 | #193 | Fair 65.0% |
| Immigrants | Southern Europe | 31.3 /100 | #194 | Fair 65.0% |
| Romanians | 31.1 /100 | #195 | Fair 65.0% |
| Haitians | 30.6 /100 | #196 | Fair 65.0% |
Demographics Similar to Immigrants from Hong Kong by In Labor Force | Age > 16
In terms of in labor force | age > 16, the demographic groups most similar to Immigrants from Hong Kong are Immigrants from France (65.7%, a difference of 0.020%), New Zealander (65.7%, a difference of 0.020%), Immigrants from Ecuador (65.7%, a difference of 0.020%), Immigrants from Iran (65.7%, a difference of 0.030%), and Immigrants from Thailand (65.7%, a difference of 0.030%).
| Demographics | Rating | Rank | In Labor Force | Age > 16 |
| Pakistanis | 97.1 /100 | #113 | Exceptional 65.8% |
| Hondurans | 97.1 /100 | #114 | Exceptional 65.8% |
| Immigrants | Indonesia | 96.8 /100 | #115 | Exceptional 65.7% |
| Argentineans | 96.7 /100 | #116 | Exceptional 65.7% |
| Immigrants | Iran | 96.6 /100 | #117 | Exceptional 65.7% |
| Immigrants | Thailand | 96.6 /100 | #118 | Exceptional 65.7% |
| Immigrants | France | 96.4 /100 | #119 | Exceptional 65.7% |
| Immigrants | Hong Kong | 96.2 /100 | #120 | Exceptional 65.7% |
| New Zealanders | 96.0 /100 | #121 | Exceptional 65.7% |
| Immigrants | Ecuador | 95.9 /100 | #122 | Exceptional 65.7% |
| Immigrants | Iraq | 95.5 /100 | #123 | Exceptional 65.7% |
| Iraqis | 95.4 /100 | #124 | Exceptional 65.7% |
| Norwegians | 95.3 /100 | #125 | Exceptional 65.7% |
| Koreans | 95.3 /100 | #126 | Exceptional 65.7% |
| Immigrants | Eastern Asia | 94.9 /100 | #127 | Exceptional 65.7% |