Taiwanese vs Northern European In Labor Force | Age 16-19
COMPARE
Taiwanese
Northern European
In Labor Force | Age 16-19
In Labor Force | Age 16-19 Comparison
Taiwanese
Northern Europeans
33.8%
IN LABOR FORCE | AGE 16-19
0.3/ 100
METRIC RATING
280th/ 347
METRIC RANK
40.2%
IN LABOR FORCE | AGE 16-19
100.0/ 100
METRIC RATING
63rd/ 347
METRIC RANK
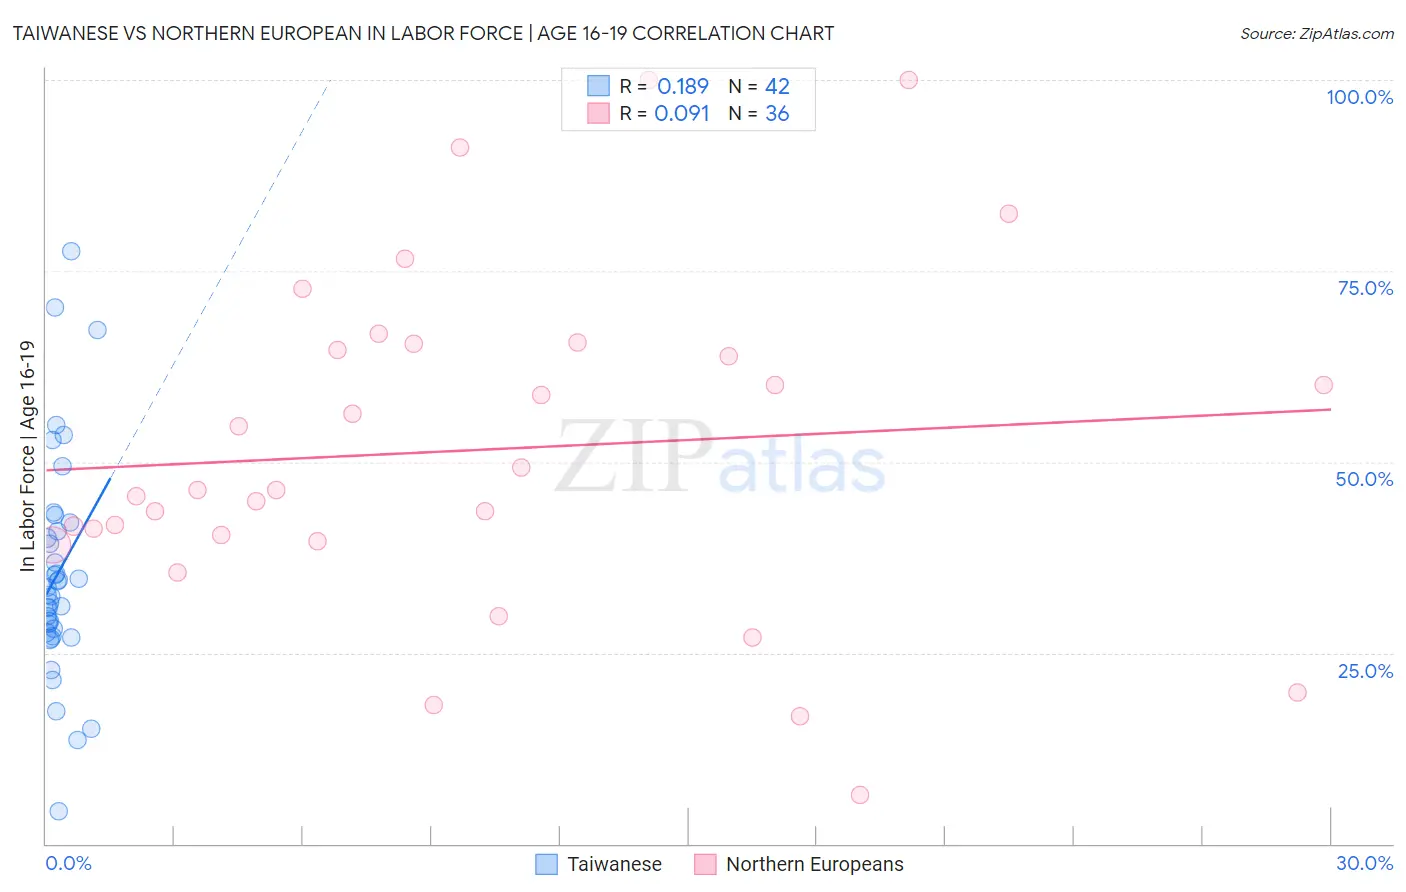
Taiwanese vs Northern European In Labor Force | Age 16-19 Correlation Chart
The statistical analysis conducted on geographies consisting of 31,721,298 people shows a poor positive correlation between the proportion of Taiwanese and labor force participation rate among population between the ages 16 and 19 in the United States with a correlation coefficient (R) of 0.189 and weighted average of 33.8%. Similarly, the statistical analysis conducted on geographies consisting of 405,208,027 people shows a slight positive correlation between the proportion of Northern Europeans and labor force participation rate among population between the ages 16 and 19 in the United States with a correlation coefficient (R) of 0.091 and weighted average of 40.2%, a difference of 18.9%.
In Labor Force | Age 16-19 Correlation Summary
| Measurement | Taiwanese | Northern European |
| Minimum | 4.3% | 6.4% |
| Maximum | 77.6% | 100.0% |
| Range | 73.3% | 93.6% |
| Mean | 35.3% | 51.6% |
| Median | 32.5% | 46.3% |
| Interquartile 25% (IQ1) | 27.6% | 40.1% |
| Interquartile 75% (IQ3) | 40.9% | 65.1% |
| Interquartile Range (IQR) | 13.3% | 25.0% |
| Standard Deviation (Sample) | 14.5% | 22.1% |
| Standard Deviation (Population) | 14.3% | 21.8% |
Similar Demographics by In Labor Force | Age 16-19
Demographics Similar to Taiwanese by In Labor Force | Age 16-19
In terms of in labor force | age 16-19, the demographic groups most similar to Taiwanese are Paraguayan (33.8%, a difference of 0.010%), Cypriot (33.8%, a difference of 0.010%), Colombian (33.8%, a difference of 0.020%), Immigrants from Korea (33.8%, a difference of 0.020%), and Menominee (33.9%, a difference of 0.090%).
| Demographics | Rating | Rank | In Labor Force | Age 16-19 |
| Immigrants | Panama | 0.4 /100 | #273 | Tragic 34.0% |
| Venezuelans | 0.3 /100 | #274 | Tragic 34.0% |
| Immigrants | Fiji | 0.3 /100 | #275 | Tragic 33.9% |
| Immigrants | Latin America | 0.3 /100 | #276 | Tragic 33.9% |
| Menominee | 0.3 /100 | #277 | Tragic 33.9% |
| Colombians | 0.3 /100 | #278 | Tragic 33.8% |
| Paraguayans | 0.3 /100 | #279 | Tragic 33.8% |
| Taiwanese | 0.3 /100 | #280 | Tragic 33.8% |
| Cypriots | 0.3 /100 | #281 | Tragic 33.8% |
| Immigrants | Korea | 0.3 /100 | #282 | Tragic 33.8% |
| Immigrants | Venezuela | 0.2 /100 | #283 | Tragic 33.7% |
| Immigrants | Spain | 0.2 /100 | #284 | Tragic 33.7% |
| U.S. Virgin Islanders | 0.2 /100 | #285 | Tragic 33.6% |
| South Americans | 0.2 /100 | #286 | Tragic 33.6% |
| Nepalese | 0.1 /100 | #287 | Tragic 33.5% |
Demographics Similar to Northern Europeans by In Labor Force | Age 16-19
In terms of in labor force | age 16-19, the demographic groups most similar to Northern Europeans are Cherokee (40.2%, a difference of 0.060%), Immigrants from Micronesia (40.2%, a difference of 0.12%), Kenyan (40.1%, a difference of 0.19%), American (40.3%, a difference of 0.20%), and Nonimmigrants (40.1%, a difference of 0.32%).
| Demographics | Rating | Rank | In Labor Force | Age 16-19 |
| Fijians | 100.0 /100 | #56 | Exceptional 40.4% |
| Lithuanians | 100.0 /100 | #57 | Exceptional 40.4% |
| Aleuts | 100.0 /100 | #58 | Exceptional 40.4% |
| Slavs | 100.0 /100 | #59 | Exceptional 40.4% |
| Immigrants | Eastern Africa | 100.0 /100 | #60 | Exceptional 40.4% |
| Americans | 100.0 /100 | #61 | Exceptional 40.3% |
| Cherokee | 100.0 /100 | #62 | Exceptional 40.2% |
| Northern Europeans | 100.0 /100 | #63 | Exceptional 40.2% |
| Immigrants | Micronesia | 100.0 /100 | #64 | Exceptional 40.2% |
| Kenyans | 100.0 /100 | #65 | Exceptional 40.1% |
| Immigrants | Nonimmigrants | 100.0 /100 | #66 | Exceptional 40.1% |
| Canadians | 100.0 /100 | #67 | Exceptional 40.1% |
| Italians | 99.9 /100 | #68 | Exceptional 40.1% |
| Potawatomi | 99.9 /100 | #69 | Exceptional 40.0% |
| Portuguese | 99.9 /100 | #70 | Exceptional 40.0% |