Taiwanese vs German In Labor Force | Age > 16
COMPARE
Taiwanese
German
In Labor Force | Age > 16
In Labor Force | Age > 16 Comparison
Taiwanese
Germans
66.2%
IN LABOR FORCE | AGE > 16
99.7/ 100
METRIC RATING
72nd/ 347
METRIC RANK
64.4%
IN LABOR FORCE | AGE > 16
1.8/ 100
METRIC RATING
249th/ 347
METRIC RANK
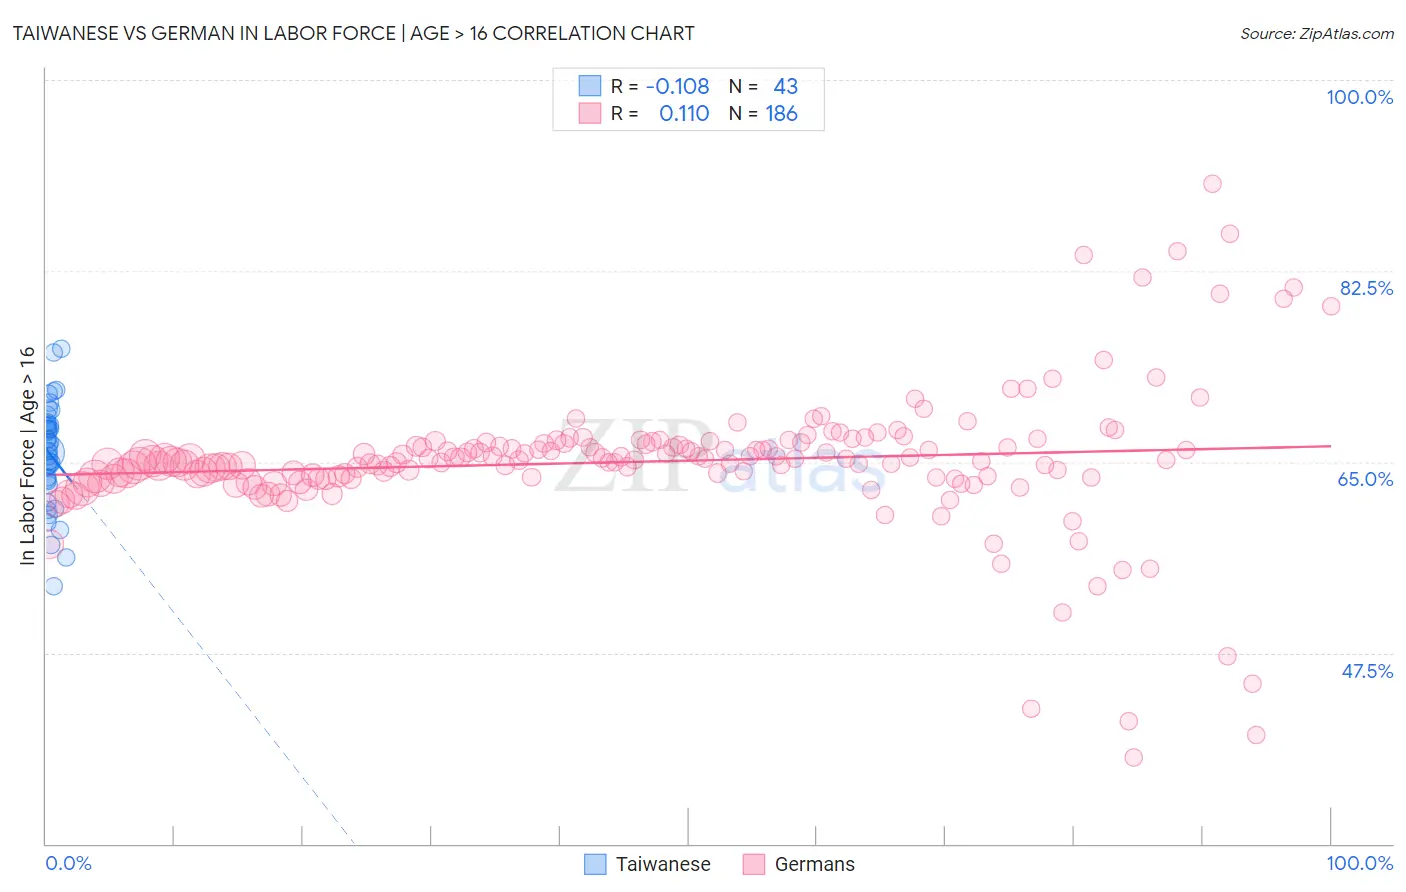
Taiwanese vs German In Labor Force | Age > 16 Correlation Chart
The statistical analysis conducted on geographies consisting of 31,724,466 people shows a poor negative correlation between the proportion of Taiwanese and labor force participation rate among population ages 16 and over in the United States with a correlation coefficient (R) of -0.108 and weighted average of 66.2%. Similarly, the statistical analysis conducted on geographies consisting of 581,290,926 people shows a poor positive correlation between the proportion of Germans and labor force participation rate among population ages 16 and over in the United States with a correlation coefficient (R) of 0.110 and weighted average of 64.4%, a difference of 2.8%.
In Labor Force | Age > 16 Correlation Summary
| Measurement | Taiwanese | German |
| Minimum | 53.6% | 37.9% |
| Maximum | 75.4% | 90.5% |
| Range | 21.8% | 52.6% |
| Mean | 65.7% | 65.0% |
| Median | 66.0% | 65.1% |
| Interquartile 25% (IQ1) | 63.2% | 63.6% |
| Interquartile 75% (IQ3) | 68.4% | 66.6% |
| Interquartile Range (IQR) | 5.2% | 3.0% |
| Standard Deviation (Sample) | 4.7% | 6.5% |
| Standard Deviation (Population) | 4.6% | 6.5% |
Similar Demographics by In Labor Force | Age > 16
Demographics Similar to Taiwanese by In Labor Force | Age > 16
In terms of in labor force | age > 16, the demographic groups most similar to Taiwanese are Burmese (66.2%, a difference of 0.0%), Immigrants from Vietnam (66.2%, a difference of 0.010%), Immigrants from Korea (66.2%, a difference of 0.010%), Asian (66.2%, a difference of 0.020%), and Immigrants from Singapore (66.2%, a difference of 0.020%).
| Demographics | Rating | Rank | In Labor Force | Age > 16 |
| Sri Lankans | 99.8 /100 | #65 | Exceptional 66.3% |
| Jordanians | 99.8 /100 | #66 | Exceptional 66.3% |
| Egyptians | 99.8 /100 | #67 | Exceptional 66.2% |
| Immigrants | Egypt | 99.7 /100 | #68 | Exceptional 66.2% |
| Sub-Saharan Africans | 99.7 /100 | #69 | Exceptional 66.2% |
| Asians | 99.7 /100 | #70 | Exceptional 66.2% |
| Burmese | 99.7 /100 | #71 | Exceptional 66.2% |
| Taiwanese | 99.7 /100 | #72 | Exceptional 66.2% |
| Immigrants | Vietnam | 99.7 /100 | #73 | Exceptional 66.2% |
| Immigrants | Korea | 99.7 /100 | #74 | Exceptional 66.2% |
| Immigrants | Singapore | 99.7 /100 | #75 | Exceptional 66.2% |
| Immigrants | Malaysia | 99.6 /100 | #76 | Exceptional 66.1% |
| Immigrants | Moldova | 99.6 /100 | #77 | Exceptional 66.1% |
| Immigrants | Asia | 99.6 /100 | #78 | Exceptional 66.1% |
| Turks | 99.6 /100 | #79 | Exceptional 66.1% |
Demographics Similar to Germans by In Labor Force | Age > 16
In terms of in labor force | age > 16, the demographic groups most similar to Germans are British West Indian (64.4%, a difference of 0.010%), Immigrants from Barbados (64.4%, a difference of 0.030%), Portuguese (64.4%, a difference of 0.030%), Swiss (64.4%, a difference of 0.040%), and Immigrants from Caribbean (64.4%, a difference of 0.060%).
| Demographics | Rating | Rank | In Labor Force | Age > 16 |
| Immigrants | Netherlands | 3.4 /100 | #242 | Tragic 64.5% |
| Immigrants | Lebanon | 3.2 /100 | #243 | Tragic 64.5% |
| Tsimshian | 3.1 /100 | #244 | Tragic 64.5% |
| West Indians | 3.0 /100 | #245 | Tragic 64.5% |
| Immigrants | Caribbean | 2.3 /100 | #246 | Tragic 64.4% |
| Swiss | 2.1 /100 | #247 | Tragic 64.4% |
| Immigrants | Barbados | 2.1 /100 | #248 | Tragic 64.4% |
| Germans | 1.8 /100 | #249 | Tragic 64.4% |
| British West Indians | 1.8 /100 | #250 | Tragic 64.4% |
| Portuguese | 1.6 /100 | #251 | Tragic 64.4% |
| Immigrants | Dominican Republic | 1.5 /100 | #252 | Tragic 64.4% |
| Czechoslovakians | 1.4 /100 | #253 | Tragic 64.3% |
| Immigrants | Uzbekistan | 1.4 /100 | #254 | Tragic 64.3% |
| Hispanics or Latinos | 1.1 /100 | #255 | Tragic 64.3% |
| Immigrants | Mexico | 1.0 /100 | #256 | Tragic 64.3% |