Taiwanese vs Celtic In Labor Force | Age > 16
COMPARE
Taiwanese
Celtic
In Labor Force | Age > 16
In Labor Force | Age > 16 Comparison
Taiwanese
Celtics
66.2%
IN LABOR FORCE | AGE > 16
99.7/ 100
METRIC RATING
72nd/ 347
METRIC RANK
63.8%
IN LABOR FORCE | AGE > 16
0.1/ 100
METRIC RATING
289th/ 347
METRIC RANK
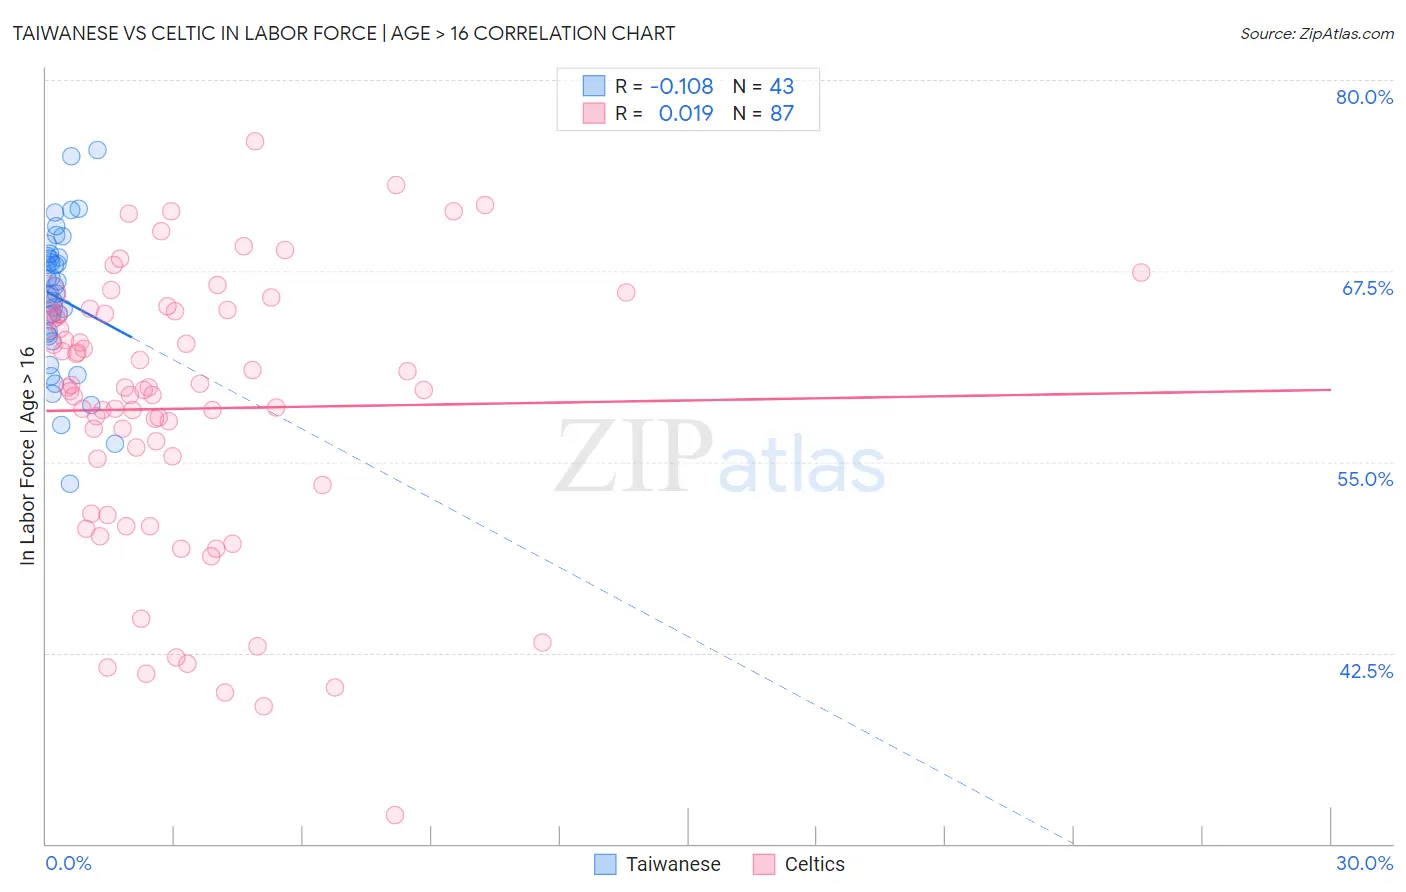
Taiwanese vs Celtic In Labor Force | Age > 16 Correlation Chart
The statistical analysis conducted on geographies consisting of 31,724,466 people shows a poor negative correlation between the proportion of Taiwanese and labor force participation rate among population ages 16 and over in the United States with a correlation coefficient (R) of -0.108 and weighted average of 66.2%. Similarly, the statistical analysis conducted on geographies consisting of 168,871,778 people shows no correlation between the proportion of Celtics and labor force participation rate among population ages 16 and over in the United States with a correlation coefficient (R) of 0.019 and weighted average of 63.8%, a difference of 3.7%.
In Labor Force | Age > 16 Correlation Summary
| Measurement | Taiwanese | Celtic |
| Minimum | 53.6% | 31.9% |
| Maximum | 75.4% | 76.0% |
| Range | 21.8% | 44.1% |
| Mean | 65.7% | 58.5% |
| Median | 66.0% | 59.7% |
| Interquartile 25% (IQ1) | 63.2% | 53.5% |
| Interquartile 75% (IQ3) | 68.4% | 64.7% |
| Interquartile Range (IQR) | 5.2% | 11.2% |
| Standard Deviation (Sample) | 4.7% | 9.0% |
| Standard Deviation (Population) | 4.6% | 9.0% |
Similar Demographics by In Labor Force | Age > 16
Demographics Similar to Taiwanese by In Labor Force | Age > 16
In terms of in labor force | age > 16, the demographic groups most similar to Taiwanese are Burmese (66.2%, a difference of 0.0%), Immigrants from Vietnam (66.2%, a difference of 0.010%), Immigrants from Korea (66.2%, a difference of 0.010%), Asian (66.2%, a difference of 0.020%), and Immigrants from Singapore (66.2%, a difference of 0.020%).
| Demographics | Rating | Rank | In Labor Force | Age > 16 |
| Sri Lankans | 99.8 /100 | #65 | Exceptional 66.3% |
| Jordanians | 99.8 /100 | #66 | Exceptional 66.3% |
| Egyptians | 99.8 /100 | #67 | Exceptional 66.2% |
| Immigrants | Egypt | 99.7 /100 | #68 | Exceptional 66.2% |
| Sub-Saharan Africans | 99.7 /100 | #69 | Exceptional 66.2% |
| Asians | 99.7 /100 | #70 | Exceptional 66.2% |
| Burmese | 99.7 /100 | #71 | Exceptional 66.2% |
| Taiwanese | 99.7 /100 | #72 | Exceptional 66.2% |
| Immigrants | Vietnam | 99.7 /100 | #73 | Exceptional 66.2% |
| Immigrants | Korea | 99.7 /100 | #74 | Exceptional 66.2% |
| Immigrants | Singapore | 99.7 /100 | #75 | Exceptional 66.2% |
| Immigrants | Malaysia | 99.6 /100 | #76 | Exceptional 66.1% |
| Immigrants | Moldova | 99.6 /100 | #77 | Exceptional 66.1% |
| Immigrants | Asia | 99.6 /100 | #78 | Exceptional 66.1% |
| Turks | 99.6 /100 | #79 | Exceptional 66.1% |
Demographics Similar to Celtics by In Labor Force | Age > 16
In terms of in labor force | age > 16, the demographic groups most similar to Celtics are Spanish (63.9%, a difference of 0.030%), Hungarian (63.8%, a difference of 0.030%), Nepalese (63.8%, a difference of 0.040%), Immigrants from Austria (63.9%, a difference of 0.080%), and Scottish (63.9%, a difference of 0.080%).
| Demographics | Rating | Rank | In Labor Force | Age > 16 |
| Immigrants | Guyana | 0.2 /100 | #282 | Tragic 64.0% |
| Immigrants | Germany | 0.1 /100 | #283 | Tragic 63.9% |
| French | 0.1 /100 | #284 | Tragic 63.9% |
| Slovaks | 0.1 /100 | #285 | Tragic 63.9% |
| Immigrants | Austria | 0.1 /100 | #286 | Tragic 63.9% |
| Scottish | 0.1 /100 | #287 | Tragic 63.9% |
| Spanish | 0.1 /100 | #288 | Tragic 63.9% |
| Celtics | 0.1 /100 | #289 | Tragic 63.8% |
| Hungarians | 0.1 /100 | #290 | Tragic 63.8% |
| Nepalese | 0.1 /100 | #291 | Tragic 63.8% |
| Spanish American Indians | 0.1 /100 | #292 | Tragic 63.8% |
| English | 0.1 /100 | #293 | Tragic 63.7% |
| Puget Sound Salish | 0.0 /100 | #294 | Tragic 63.7% |
| Immigrants | Canada | 0.0 /100 | #295 | Tragic 63.7% |
| Immigrants | North America | 0.0 /100 | #296 | Tragic 63.7% |