Immigrants from Africa vs Palestinian In Labor Force | Age 35-44
COMPARE
Immigrants from Africa
Palestinian
In Labor Force | Age 35-44
In Labor Force | Age 35-44 Comparison
Immigrants from Africa
Palestinians
84.9%
IN LABOR FORCE | AGE 35-44
98.4/ 100
METRIC RATING
78th/ 347
METRIC RANK
84.7%
IN LABOR FORCE | AGE 35-44
89.7/ 100
METRIC RATING
129th/ 347
METRIC RANK
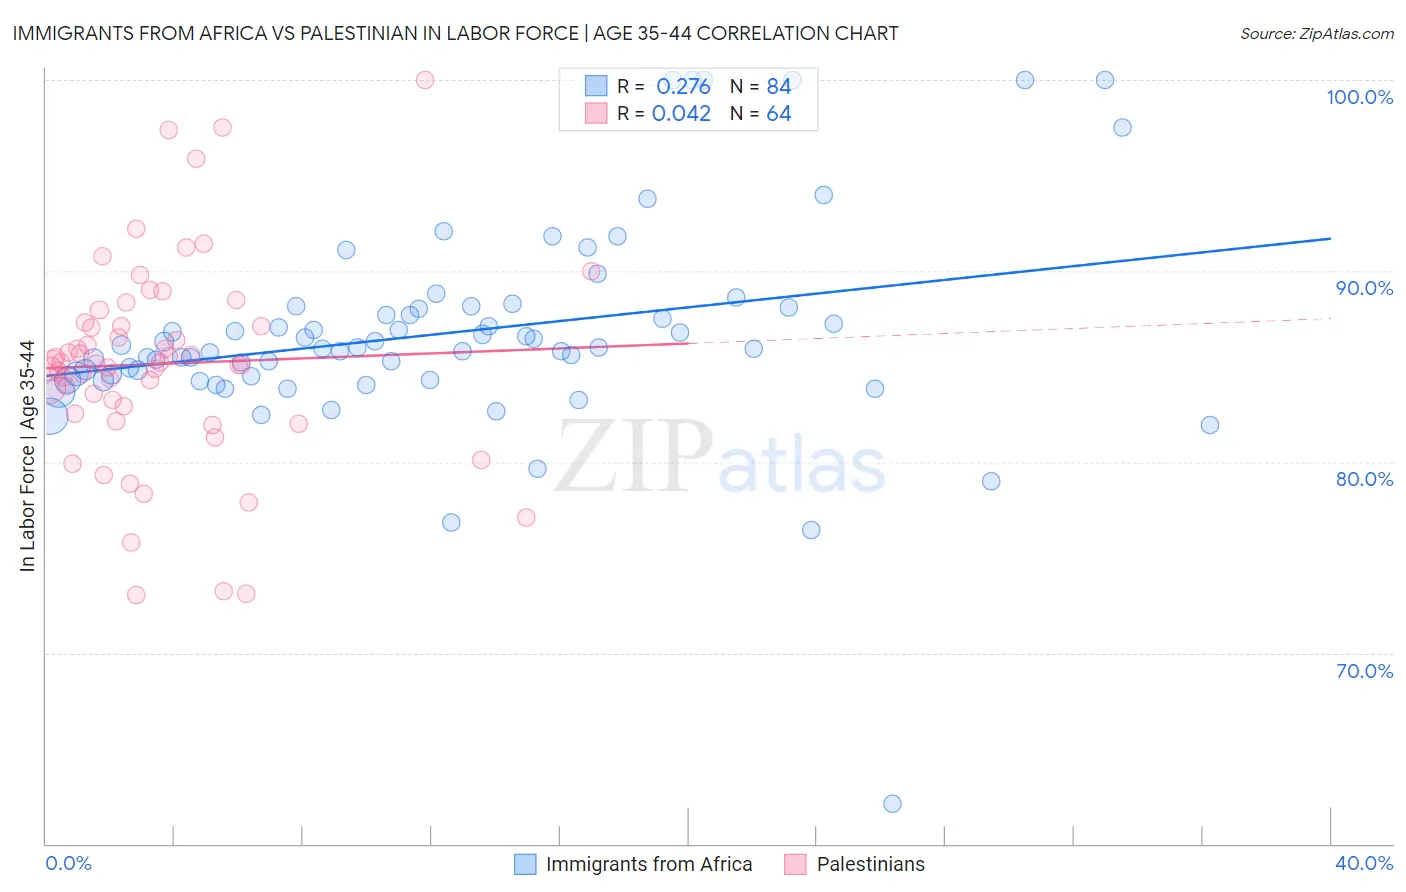
Immigrants from Africa vs Palestinian In Labor Force | Age 35-44 Correlation Chart
The statistical analysis conducted on geographies consisting of 469,061,471 people shows a weak positive correlation between the proportion of Immigrants from Africa and labor force participation rate among population between the ages 35 and 44 in the United States with a correlation coefficient (R) of 0.276 and weighted average of 84.9%. Similarly, the statistical analysis conducted on geographies consisting of 216,394,739 people shows no correlation between the proportion of Palestinians and labor force participation rate among population between the ages 35 and 44 in the United States with a correlation coefficient (R) of 0.042 and weighted average of 84.7%, a difference of 0.31%.
In Labor Force | Age 35-44 Correlation Summary
| Measurement | Immigrants from Africa | Palestinian |
| Minimum | 62.1% | 73.0% |
| Maximum | 100.0% | 100.0% |
| Range | 37.9% | 27.0% |
| Mean | 86.8% | 85.1% |
| Median | 86.0% | 85.2% |
| Interquartile 25% (IQ1) | 84.4% | 82.7% |
| Interquartile 75% (IQ3) | 88.0% | 87.2% |
| Interquartile Range (IQR) | 3.7% | 4.5% |
| Standard Deviation (Sample) | 5.6% | 5.4% |
| Standard Deviation (Population) | 5.5% | 5.3% |
Similar Demographics by In Labor Force | Age 35-44
Demographics Similar to Immigrants from Africa by In Labor Force | Age 35-44
In terms of in labor force | age 35-44, the demographic groups most similar to Immigrants from Africa are Peruvian (84.9%, a difference of 0.0%), Immigrants from Colombia (84.9%, a difference of 0.010%), Immigrants from Eastern Europe (84.9%, a difference of 0.010%), Immigrants from South Central Asia (85.0%, a difference of 0.030%), and Immigrants from Cuba (84.9%, a difference of 0.030%).
| Demographics | Rating | Rank | In Labor Force | Age 35-44 |
| Russians | 99.0 /100 | #71 | Exceptional 85.0% |
| Immigrants | Singapore | 98.9 /100 | #72 | Exceptional 85.0% |
| Immigrants | Sri Lanka | 98.9 /100 | #73 | Exceptional 85.0% |
| Colombians | 98.8 /100 | #74 | Exceptional 85.0% |
| Immigrants | South Central Asia | 98.7 /100 | #75 | Exceptional 85.0% |
| Immigrants | Cuba | 98.6 /100 | #76 | Exceptional 84.9% |
| Immigrants | Turkey | 98.6 /100 | #77 | Exceptional 84.9% |
| Immigrants | Africa | 98.4 /100 | #78 | Exceptional 84.9% |
| Peruvians | 98.3 /100 | #79 | Exceptional 84.9% |
| Immigrants | Colombia | 98.3 /100 | #80 | Exceptional 84.9% |
| Immigrants | Eastern Europe | 98.3 /100 | #81 | Exceptional 84.9% |
| Immigrants | Sudan | 98.1 /100 | #82 | Exceptional 84.9% |
| Senegalese | 97.8 /100 | #83 | Exceptional 84.9% |
| Immigrants | Peru | 97.8 /100 | #84 | Exceptional 84.9% |
| Immigrants | Middle Africa | 97.8 /100 | #85 | Exceptional 84.9% |
Demographics Similar to Palestinians by In Labor Force | Age 35-44
In terms of in labor force | age 35-44, the demographic groups most similar to Palestinians are Bhutanese (84.7%, a difference of 0.0%), Immigrants from Scotland (84.7%, a difference of 0.0%), Austrian (84.7%, a difference of 0.0%), Immigrants from Ghana (84.7%, a difference of 0.010%), and German (84.7%, a difference of 0.020%).
| Demographics | Rating | Rank | In Labor Force | Age 35-44 |
| Germans | 91.0 /100 | #122 | Exceptional 84.7% |
| Immigrants | South America | 90.9 /100 | #123 | Exceptional 84.7% |
| Slavs | 90.8 /100 | #124 | Exceptional 84.7% |
| Maltese | 90.8 /100 | #125 | Exceptional 84.7% |
| Asians | 90.6 /100 | #126 | Exceptional 84.7% |
| Immigrants | Spain | 90.6 /100 | #127 | Exceptional 84.7% |
| Immigrants | Ghana | 90.4 /100 | #128 | Exceptional 84.7% |
| Palestinians | 89.7 /100 | #129 | Excellent 84.7% |
| Bhutanese | 89.7 /100 | #130 | Excellent 84.7% |
| Immigrants | Scotland | 89.6 /100 | #131 | Excellent 84.7% |
| Austrians | 89.4 /100 | #132 | Excellent 84.7% |
| Argentineans | 88.4 /100 | #133 | Excellent 84.6% |
| Immigrants | Korea | 88.2 /100 | #134 | Excellent 84.6% |
| Immigrants | Malaysia | 87.5 /100 | #135 | Excellent 84.6% |
| Afghans | 86.3 /100 | #136 | Excellent 84.6% |