Nonimmigrants vs Aleut In Labor Force | Age 35-44
COMPARE
Nonimmigrants
Aleut
In Labor Force | Age 35-44
In Labor Force | Age 35-44 Comparison
Nonimmigrants
Aleuts
83.2%
IN LABOR FORCE | AGE 35-44
0.0/ 100
METRIC RATING
274th/ 347
METRIC RANK
84.4%
IN LABOR FORCE | AGE 35-44
59.1/ 100
METRIC RATING
163rd/ 347
METRIC RANK
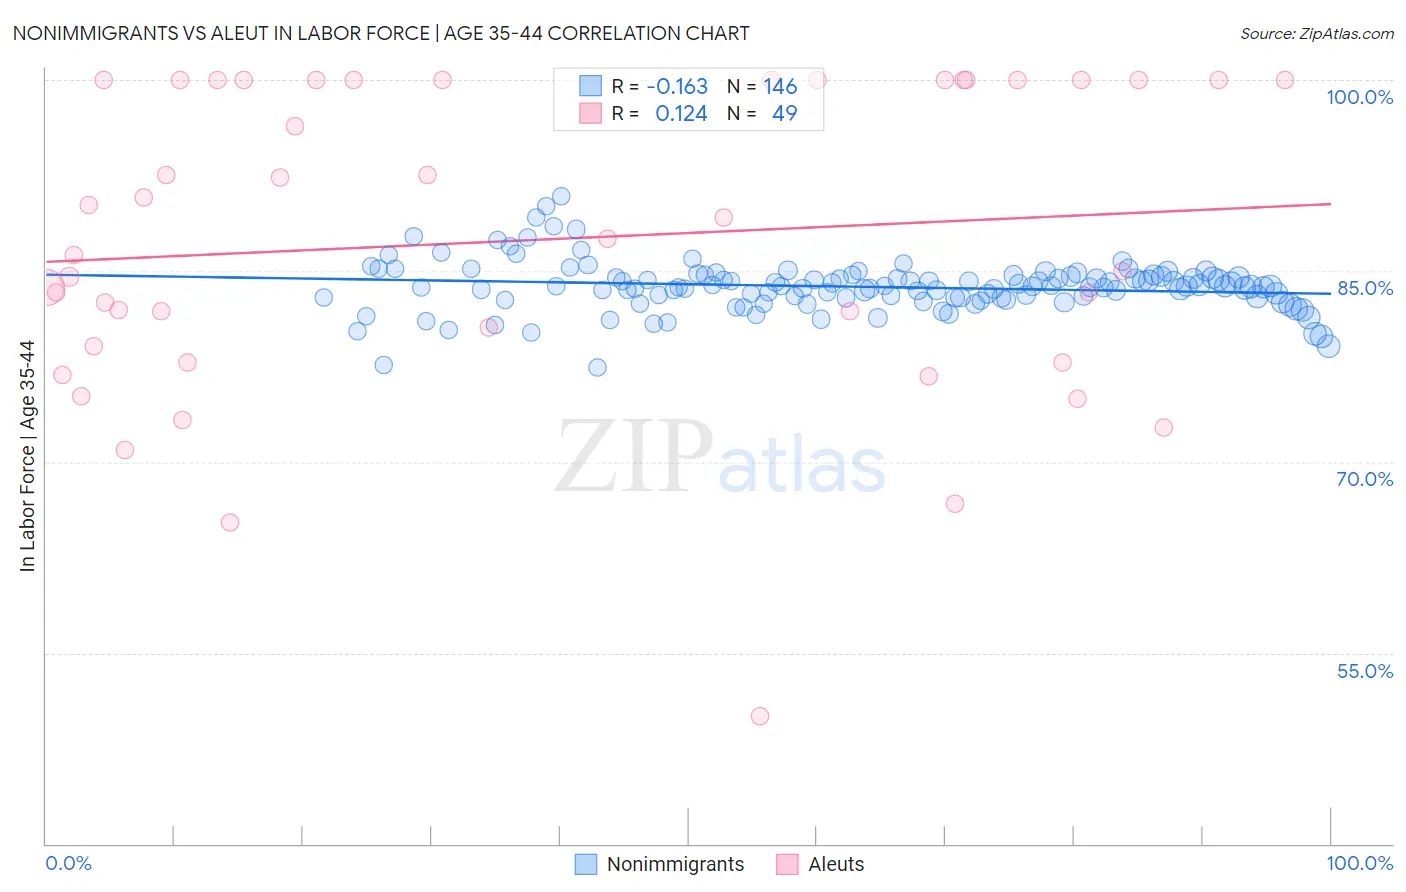
Nonimmigrants vs Aleut In Labor Force | Age 35-44 Correlation Chart
The statistical analysis conducted on geographies consisting of 584,065,526 people shows a poor negative correlation between the proportion of Nonimmigrants and labor force participation rate among population between the ages 35 and 44 in the United States with a correlation coefficient (R) of -0.163 and weighted average of 83.2%. Similarly, the statistical analysis conducted on geographies consisting of 61,775,675 people shows a poor positive correlation between the proportion of Aleuts and labor force participation rate among population between the ages 35 and 44 in the United States with a correlation coefficient (R) of 0.124 and weighted average of 84.4%, a difference of 1.4%.
In Labor Force | Age 35-44 Correlation Summary
| Measurement | Nonimmigrants | Aleut |
| Minimum | 77.4% | 50.0% |
| Maximum | 90.8% | 100.0% |
| Range | 13.4% | 50.0% |
| Mean | 83.8% | 87.4% |
| Median | 83.8% | 87.5% |
| Interquartile 25% (IQ1) | 82.9% | 78.4% |
| Interquartile 75% (IQ3) | 84.6% | 100.0% |
| Interquartile Range (IQR) | 1.7% | 21.6% |
| Standard Deviation (Sample) | 2.0% | 12.0% |
| Standard Deviation (Population) | 2.0% | 11.9% |
Similar Demographics by In Labor Force | Age 35-44
Demographics Similar to Nonimmigrants by In Labor Force | Age 35-44
In terms of in labor force | age 35-44, the demographic groups most similar to Nonimmigrants are Immigrants from Fiji (83.2%, a difference of 0.020%), Spanish (83.2%, a difference of 0.020%), Hawaiian (83.2%, a difference of 0.020%), Delaware (83.2%, a difference of 0.030%), and Samoan (83.2%, a difference of 0.030%).
| Demographics | Rating | Rank | In Labor Force | Age 35-44 |
| Guamanians/Chamorros | 0.1 /100 | #267 | Tragic 83.4% |
| Hondurans | 0.1 /100 | #268 | Tragic 83.4% |
| Immigrants | Grenada | 0.1 /100 | #269 | Tragic 83.3% |
| Immigrants | Honduras | 0.0 /100 | #270 | Tragic 83.3% |
| French American Indians | 0.0 /100 | #271 | Tragic 83.2% |
| Immigrants | Fiji | 0.0 /100 | #272 | Tragic 83.2% |
| Spanish | 0.0 /100 | #273 | Tragic 83.2% |
| Immigrants | Nonimmigrants | 0.0 /100 | #274 | Tragic 83.2% |
| Hawaiians | 0.0 /100 | #275 | Tragic 83.2% |
| Delaware | 0.0 /100 | #276 | Tragic 83.2% |
| Samoans | 0.0 /100 | #277 | Tragic 83.2% |
| Belizeans | 0.0 /100 | #278 | Tragic 83.1% |
| Immigrants | Micronesia | 0.0 /100 | #279 | Tragic 83.1% |
| Dominicans | 0.0 /100 | #280 | Tragic 83.1% |
| Guatemalans | 0.0 /100 | #281 | Tragic 83.0% |
Demographics Similar to Aleuts by In Labor Force | Age 35-44
In terms of in labor force | age 35-44, the demographic groups most similar to Aleuts are Immigrants from Hungary (84.4%, a difference of 0.0%), Nigerian (84.4%, a difference of 0.0%), Immigrants from Senegal (84.4%, a difference of 0.010%), Immigrants from Kazakhstan (84.4%, a difference of 0.010%), and Immigrants from Venezuela (84.4%, a difference of 0.010%).
| Demographics | Rating | Rank | In Labor Force | Age 35-44 |
| Immigrants | Israel | 64.3 /100 | #156 | Good 84.4% |
| Immigrants | Austria | 63.8 /100 | #157 | Good 84.4% |
| Jamaicans | 62.7 /100 | #158 | Good 84.4% |
| Immigrants | Senegal | 60.4 /100 | #159 | Good 84.4% |
| Immigrants | Kazakhstan | 60.4 /100 | #160 | Good 84.4% |
| Immigrants | Venezuela | 60.0 /100 | #161 | Good 84.4% |
| Immigrants | Hungary | 59.4 /100 | #162 | Average 84.4% |
| Aleuts | 59.1 /100 | #163 | Average 84.4% |
| Nigerians | 58.9 /100 | #164 | Average 84.4% |
| Venezuelans | 58.1 /100 | #165 | Average 84.4% |
| Alsatians | 55.2 /100 | #166 | Average 84.4% |
| Immigrants | Portugal | 55.2 /100 | #167 | Average 84.4% |
| Irish | 53.1 /100 | #168 | Average 84.4% |
| Immigrants | Afghanistan | 52.7 /100 | #169 | Average 84.4% |
| Immigrants | Jordan | 52.5 /100 | #170 | Average 84.4% |