Immigrants from Ukraine vs Immigrants from Norway In Labor Force | Age 30-34
COMPARE
Immigrants from Ukraine
Immigrants from Norway
In Labor Force | Age 30-34
In Labor Force | Age 30-34 Comparison
Immigrants from Ukraine
Immigrants from Norway
84.8%
IN LABOR FORCE | AGE 30-34
75.1/ 100
METRIC RATING
149th/ 347
METRIC RANK
85.2%
IN LABOR FORCE | AGE 30-34
97.6/ 100
METRIC RATING
93rd/ 347
METRIC RANK
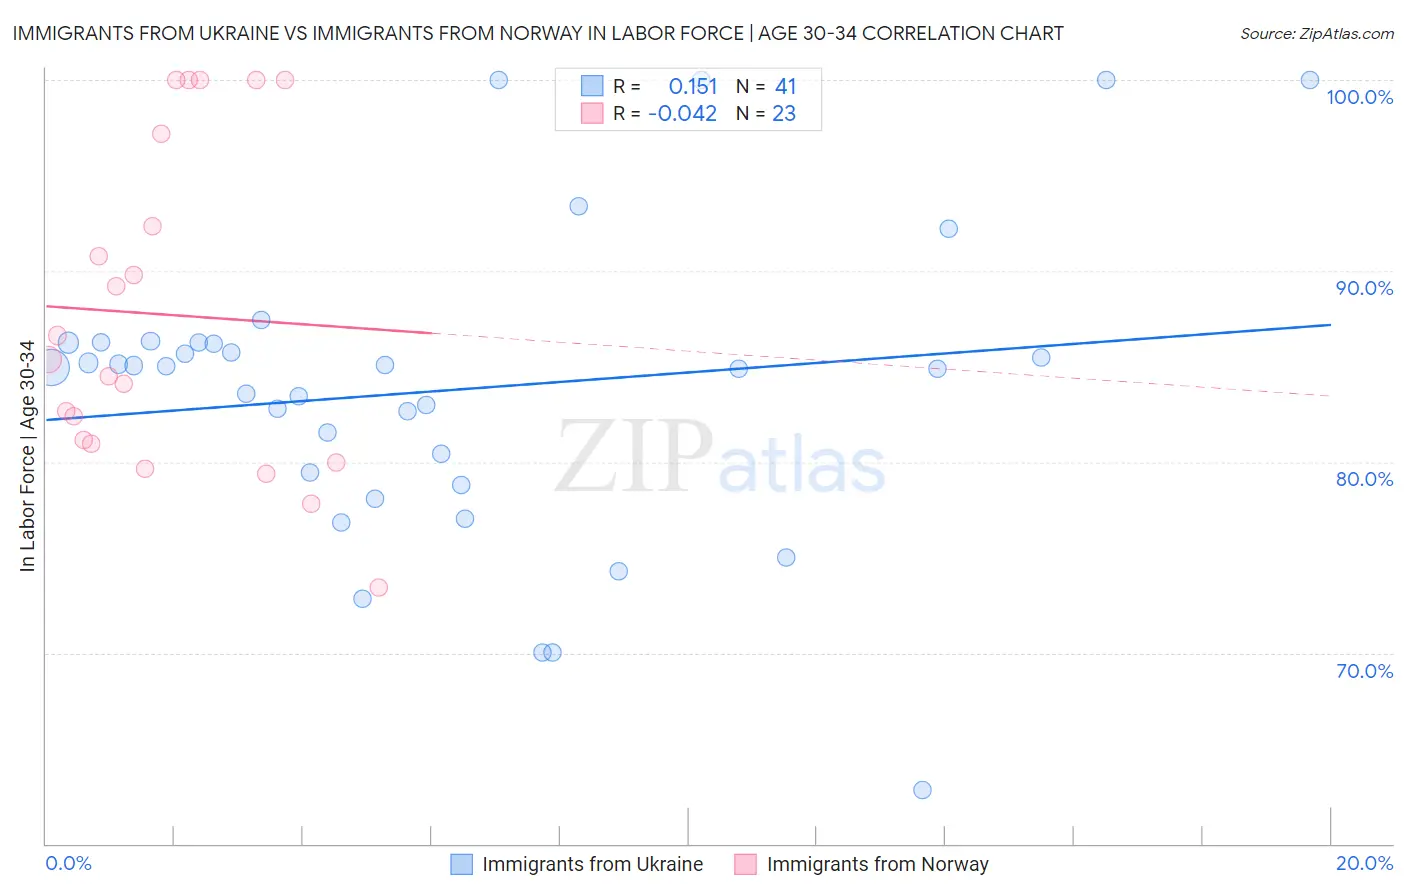
Immigrants from Ukraine vs Immigrants from Norway In Labor Force | Age 30-34 Correlation Chart
The statistical analysis conducted on geographies consisting of 289,628,945 people shows a poor positive correlation between the proportion of Immigrants from Ukraine and labor force participation rate among population between the ages 30 and 34 in the United States with a correlation coefficient (R) of 0.151 and weighted average of 84.8%. Similarly, the statistical analysis conducted on geographies consisting of 116,700,143 people shows no correlation between the proportion of Immigrants from Norway and labor force participation rate among population between the ages 30 and 34 in the United States with a correlation coefficient (R) of -0.042 and weighted average of 85.2%, a difference of 0.45%.
In Labor Force | Age 30-34 Correlation Summary
| Measurement | Immigrants from Ukraine | Immigrants from Norway |
| Minimum | 62.8% | 73.4% |
| Maximum | 100.0% | 100.0% |
| Range | 37.2% | 26.6% |
| Mean | 83.7% | 87.7% |
| Median | 85.0% | 85.4% |
| Interquartile 25% (IQ1) | 79.1% | 81.0% |
| Interquartile 75% (IQ3) | 86.3% | 97.2% |
| Interquartile Range (IQR) | 7.1% | 16.2% |
| Standard Deviation (Sample) | 8.0% | 8.4% |
| Standard Deviation (Population) | 7.9% | 8.2% |
Similar Demographics by In Labor Force | Age 30-34
Demographics Similar to Immigrants from Ukraine by In Labor Force | Age 30-34
In terms of in labor force | age 30-34, the demographic groups most similar to Immigrants from Ukraine are German (84.8%, a difference of 0.0%), Immigrants from Saudi Arabia (84.9%, a difference of 0.010%), Immigrants from Colombia (84.9%, a difference of 0.010%), Immigrants from Pakistan (84.9%, a difference of 0.010%), and Immigrants from Senegal (84.8%, a difference of 0.010%).
| Demographics | Rating | Rank | In Labor Force | Age 30-34 |
| Immigrants | Indonesia | 84.3 /100 | #142 | Excellent 84.9% |
| Colombians | 82.2 /100 | #143 | Excellent 84.9% |
| Uruguayans | 78.5 /100 | #144 | Good 84.9% |
| Palestinians | 77.7 /100 | #145 | Good 84.9% |
| Immigrants | Saudi Arabia | 76.6 /100 | #146 | Good 84.9% |
| Immigrants | Colombia | 76.3 /100 | #147 | Good 84.9% |
| Immigrants | Pakistan | 76.2 /100 | #148 | Good 84.9% |
| Immigrants | Ukraine | 75.1 /100 | #149 | Good 84.8% |
| Germans | 75.1 /100 | #150 | Good 84.8% |
| Immigrants | Senegal | 74.0 /100 | #151 | Good 84.8% |
| Romanians | 73.5 /100 | #152 | Good 84.8% |
| Syrians | 70.1 /100 | #153 | Good 84.8% |
| Northern Europeans | 70.0 /100 | #154 | Good 84.8% |
| Immigrants | Sudan | 69.5 /100 | #155 | Good 84.8% |
| French Canadians | 67.3 /100 | #156 | Good 84.8% |
Demographics Similar to Immigrants from Norway by In Labor Force | Age 30-34
In terms of in labor force | age 30-34, the demographic groups most similar to Immigrants from Norway are German Russian (85.2%, a difference of 0.010%), Swedish (85.2%, a difference of 0.010%), Immigrants from India (85.2%, a difference of 0.010%), Immigrants from Moldova (85.3%, a difference of 0.020%), and Immigrants from Korea (85.2%, a difference of 0.020%).
| Demographics | Rating | Rank | In Labor Force | Age 30-34 |
| Immigrants | Taiwan | 98.3 /100 | #86 | Exceptional 85.3% |
| Immigrants | Northern Europe | 98.2 /100 | #87 | Exceptional 85.3% |
| Immigrants | Belgium | 98.2 /100 | #88 | Exceptional 85.3% |
| Immigrants | Kazakhstan | 98.1 /100 | #89 | Exceptional 85.3% |
| Burmese | 97.9 /100 | #90 | Exceptional 85.3% |
| Immigrants | Moldova | 97.9 /100 | #91 | Exceptional 85.3% |
| German Russians | 97.7 /100 | #92 | Exceptional 85.2% |
| Immigrants | Norway | 97.6 /100 | #93 | Exceptional 85.2% |
| Swedes | 97.5 /100 | #94 | Exceptional 85.2% |
| Immigrants | India | 97.4 /100 | #95 | Exceptional 85.2% |
| Immigrants | Korea | 97.3 /100 | #96 | Exceptional 85.2% |
| Thais | 97.2 /100 | #97 | Exceptional 85.2% |
| Immigrants | Uganda | 97.2 /100 | #98 | Exceptional 85.2% |
| Belgians | 97.2 /100 | #99 | Exceptional 85.2% |
| Sudanese | 97.1 /100 | #100 | Exceptional 85.2% |