Sudanese vs Immigrants from Norway Bachelor's Degree
COMPARE
Sudanese
Immigrants from Norway
Bachelor's Degree
Bachelor's Degree Comparison
Sudanese
Immigrants from Norway
38.9%
BACHELOR'S DEGREE
76.4/ 100
METRIC RATING
152nd/ 347
METRIC RANK
44.5%
BACHELOR'S DEGREE
99.9/ 100
METRIC RATING
49th/ 347
METRIC RANK
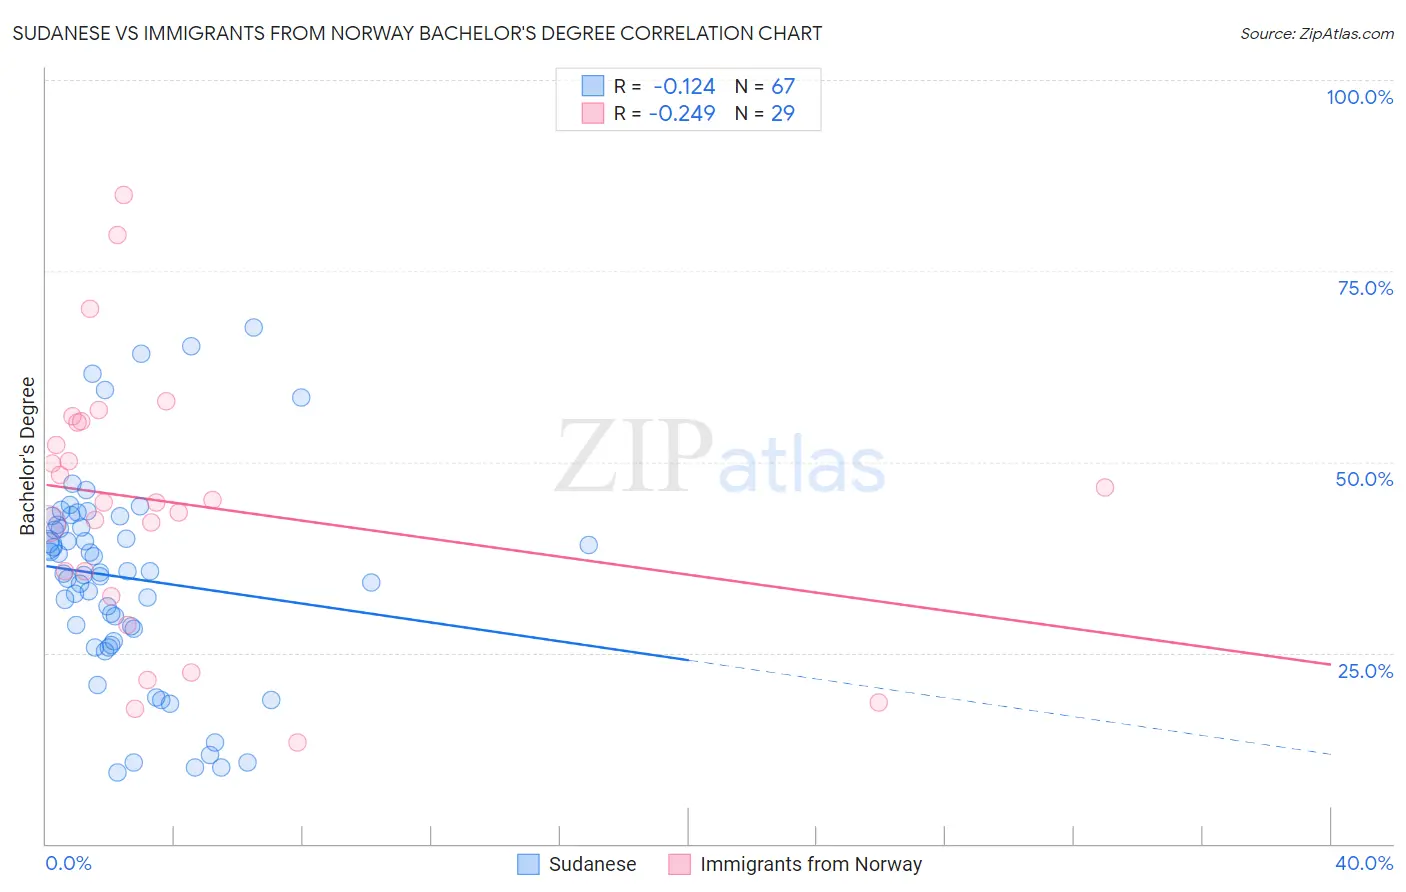
Sudanese vs Immigrants from Norway Bachelor's Degree Correlation Chart
The statistical analysis conducted on geographies consisting of 110,140,841 people shows a poor negative correlation between the proportion of Sudanese and percentage of population with at least bachelor's degree education in the United States with a correlation coefficient (R) of -0.124 and weighted average of 38.9%. Similarly, the statistical analysis conducted on geographies consisting of 116,713,560 people shows a weak negative correlation between the proportion of Immigrants from Norway and percentage of population with at least bachelor's degree education in the United States with a correlation coefficient (R) of -0.249 and weighted average of 44.5%, a difference of 14.4%.
Bachelor's Degree Correlation Summary
| Measurement | Sudanese | Immigrants from Norway |
| Minimum | 9.3% | 13.2% |
| Maximum | 67.6% | 84.9% |
| Range | 58.3% | 71.7% |
| Mean | 34.8% | 44.6% |
| Median | 35.5% | 44.8% |
| Interquartile 25% (IQ1) | 26.5% | 34.0% |
| Interquartile 75% (IQ3) | 41.8% | 55.3% |
| Interquartile Range (IQR) | 15.3% | 21.2% |
| Standard Deviation (Sample) | 13.4% | 17.2% |
| Standard Deviation (Population) | 13.3% | 16.9% |
Similar Demographics by Bachelor's Degree
Demographics Similar to Sudanese by Bachelor's Degree
In terms of bachelor's degree, the demographic groups most similar to Sudanese are Immigrants from Africa (38.9%, a difference of 0.020%), Slavic (38.9%, a difference of 0.060%), South American (38.9%, a difference of 0.12%), Immigrants from Poland (39.0%, a difference of 0.15%), and Canadian (38.8%, a difference of 0.18%).
| Demographics | Rating | Rank | Bachelor's Degree |
| Slovenes | 79.5 /100 | #145 | Good 39.1% |
| Swedes | 79.2 /100 | #146 | Good 39.1% |
| Immigrants | Sierra Leone | 79.0 /100 | #147 | Good 39.0% |
| Iraqis | 78.1 /100 | #148 | Good 39.0% |
| Immigrants | Poland | 77.5 /100 | #149 | Good 39.0% |
| South Americans | 77.3 /100 | #150 | Good 38.9% |
| Immigrants | Africa | 76.5 /100 | #151 | Good 38.9% |
| Sudanese | 76.4 /100 | #152 | Good 38.9% |
| Slavs | 75.9 /100 | #153 | Good 38.9% |
| Canadians | 75.0 /100 | #154 | Good 38.8% |
| Immigrants | Kenya | 73.8 /100 | #155 | Good 38.8% |
| Kenyans | 72.5 /100 | #156 | Good 38.7% |
| Immigrants | South America | 70.1 /100 | #157 | Good 38.6% |
| Immigrants | Germany | 69.6 /100 | #158 | Good 38.6% |
| Chinese | 66.6 /100 | #159 | Good 38.5% |
Demographics Similar to Immigrants from Norway by Bachelor's Degree
In terms of bachelor's degree, the demographic groups most similar to Immigrants from Norway are Bolivian (44.6%, a difference of 0.12%), Estonian (44.6%, a difference of 0.12%), Immigrants from Greece (44.5%, a difference of 0.12%), Immigrants from Bulgaria (44.6%, a difference of 0.16%), and Immigrants from Kuwait (44.6%, a difference of 0.22%).
| Demographics | Rating | Rank | Bachelor's Degree |
| Immigrants | Saudi Arabia | 100.0 /100 | #42 | Exceptional 44.8% |
| Immigrants | South Africa | 99.9 /100 | #43 | Exceptional 44.8% |
| Immigrants | Lithuania | 99.9 /100 | #44 | Exceptional 44.6% |
| Immigrants | Kuwait | 99.9 /100 | #45 | Exceptional 44.6% |
| Immigrants | Bulgaria | 99.9 /100 | #46 | Exceptional 44.6% |
| Bolivians | 99.9 /100 | #47 | Exceptional 44.6% |
| Estonians | 99.9 /100 | #48 | Exceptional 44.6% |
| Immigrants | Norway | 99.9 /100 | #49 | Exceptional 44.5% |
| Immigrants | Greece | 99.9 /100 | #50 | Exceptional 44.5% |
| Asians | 99.9 /100 | #51 | Exceptional 44.4% |
| Immigrants | Spain | 99.9 /100 | #52 | Exceptional 44.3% |
| Immigrants | Asia | 99.9 /100 | #53 | Exceptional 44.3% |
| Immigrants | Austria | 99.9 /100 | #54 | Exceptional 44.2% |
| Immigrants | Bolivia | 99.9 /100 | #55 | Exceptional 44.2% |
| Immigrants | Serbia | 99.9 /100 | #56 | Exceptional 44.1% |